A Founder’s Guide to Improving Return on Shopify
Relying solely on the Return on Ad Spend (ROAS) your ad platforms report is one of the biggest—and most common—mistakes I see Shopify brands make. The numbers staring back at you from your Meta or Google dashboards can look fantastic, but they're not telling you the whole story. They don't factor in your product costs, transaction fees, or attribution overlaps, which makes it terrifyingly easy to pour money into campaigns that are silently losing you money.
To get a real sense of your return on Shopify, you have to dig deeper than these surface-level metrics and get to genuine profitability.
Why Your Blended ROAS Is Hiding the Truth

So many founders and marketers live and die by that single ROAS figure. Seeing a 4x ROAS on a Meta campaign feels like a huge win, but on its own, that number is dangerously incomplete. It only shows you the revenue generated for every dollar you spent on ads, completely ignoring the cost side of your business.
Let’s run through a quick, real-world scenario. You spend $100 on ads and bring in $400 in sales—that’s a 4.0 ROAS. Looks great, right? But what if the Cost of Goods Sold (COGS) for those products was $250, and Shopify's transaction fees came to another $15? Your total cost is actually $365 ($100 ad spend + $250 COGS + $15 fees).
Suddenly, your net profit is just $35. That impressive 4.0 ROAS is masking a razor-thin margin that could vanish with the slightest dip in performance.
The Problem with Platform Attribution
Attribution gaps throw another wrench in the works. Every ad platform—Meta, Google, TikTok—is fighting to take credit for a conversion. If a customer clicks a Facebook ad, then later clicks a Google Shopping ad before finally buying, both platforms might chalk up the full sale to their own efforts.
This overlap leads to rampant double-counting, which inflates the performance you see on each channel. You might be looking at a 3.0 ROAS on Meta and a 2.5 ROAS on Google for the exact same pool of sales, making you think your blended performance is solid. The reality? Your true, deduplicated ROAS is much, much lower.
The disconnect between platform-reported ROAS and what actually hits your bank account is stark. One measures ad efficiency in a vacuum, while the other reflects true business health.
Platform ROAS vs True Profitability
Metric | Platform-Reported ROAS | True Return on Shopify |
|---|---|---|
Primary Goal | Measures ad campaign efficiency (revenue per ad dollar). | Measures actual business profitability (profit per ad dollar). |
Key Inputs | Ad Spend, Revenue Attributed by the Platform. | Ad Spend, Gross Revenue, COGS, Fees, Discounts. |
Attribution | Often overlaps, crediting multiple channels for one sale. | Deduplicated, single source of truth (e.g., Shopify). |
Blind Spots | Ignores product costs, shipping, transaction fees, and returns. | Provides a complete financial picture of each transaction. |
Typical Outcome | Can create a false sense of security with inflated numbers. | Reveals which campaigns and products are actually profitable. |
Ultimately, you need to shift your focus from vanity metrics to the numbers that truly matter for your bottom line.
The core issue is that ad platforms measure media efficiency, not business profitability. Your goal isn't just to get a high ROAS; it's to generate profitable growth. To do that, you must connect ad spend to actual profit, not just revenue.
This is precisely why a solid financial foundation on Shopify is so crucial. The platform’s own health and efficiency directly impact your potential for success. For instance, in a recent quarter, Shopify's Merchant Solutions revenue grew by 19% to nearly $1.5 billion, while its subscription revenue jumped 27%. This growth, paired with improving operating margins, shows Shopify is actively reinvesting in tools to boost checkout conversion and smooth out the selling process. You can learn more about how Shopify's financial strength impacts merchant ROI and why it matters for your business.
At the end of the day, a profitable return on Shopify comes from looking past the platform numbers and zeroing in on what truly drives your business forward: net profit, calculated down to the individual product and campaign.
Building a Reliable Measurement and Attribution Stack
If you want to accurately measure your return on Shopify, you need data you can actually trust. This all starts with a rock-solid technical foundation. You have to ensure the signals firing from your store to your ad platforms are as clean and complete as humanly possible. If you skip this, you’re just making decisions based on shaky, incomplete information.
The first move is to get beyond the basic pixel setup. For platforms like Meta and Google, that means integrating their server-side APIs. Your pixel is great for capturing browser events, but it's easily tripped up by ad blockers and privacy updates. The Conversions API (CAPI) for Meta and Enhanced Conversions for Google send data directly from your server to theirs, which creates a far more durable and reliable data pipeline.
Nail Your Tracking and Naming Conventions
A proper setup means you're capturing every crucial customer action—from Add to Cart and Initiate Checkout right through to the final Purchase. Tracking all these events gives you a much clearer picture of your funnel and, just as importantly, feeds the ad platform algorithms the data they need to find you better customers. But collecting data is only half the battle. You also have to organize it.
This is where a strict, almost religious approach to UTM parameters comes in. UTMs are just simple tags you add to your URLs that tell your analytics tools exactly where your traffic is coming from. A disciplined campaign naming convention is your single best defense against data chaos.
A messy UTM structure is a self-inflicted wound. It makes it impossible to trace a customer’s journey from ad click to purchase, turning your analytics into a pure guessing game. Get this right from day one.
For instance, a standardized structure might look like this:
utm_source:
metaorgoogleutm_medium:
cpcorsocialutm_campaign:
Brand-Prospecting-HolidaySale24utm_content:
VideoAd-CozySweater-V1utm_term:
womens-cashmere-sweaters(for search campaigns)
This kind of consistency lets you slice and dice your data with real precision, connecting sales directly back to the specific campaign, ad set, and creative that actually did the work.
Establishing a Single Source of Truth
With data pouring in from multiple ad platforms, and each one trying to claim credit for the same sales, you have to pick a single source of truth. For most brands, this should be Shopify’s own analytics.
Shopify sees every single transaction that actually clears. It gives you a deduplicated view of your sales that isn't inflated by overlapping platform attribution windows.
While the ad platforms are fantastic for in-flight campaign optimizations, your Shopify backend is where you should measure definitive business performance. This approach saves you from the analysis paralysis of trying to reconcile three different reports that never quite add up. If you need a more sophisticated view, it's worth exploring specialized marketing attribution software that can pull everything together.
The goal is simple: pick one place to get your final numbers and stick with it. That’s how you build the consistency needed to calculate a true return on Shopify.
Calculating True Profitability Down to the SKU
If you really want to understand your performance, you have to look past the ROAS numbers your ad platforms are showing you. It's time to shift your focus from revenue to actual, take-home profit. To get a real measure of your return on Shopify, you need a financial model that tracks every single variable cost tied to a sale—not just what you spent on ads.
This is the only way to figure out which products are truly fueling your growth and which ones are quietly eating away at your budget.
Your mission is to calculate the net profit for every single order. That means connecting the dots between your ad platforms and your Shopify backend, which is where a solid attribution stack becomes non-negotiable. The data needs to flow cleanly from an ad click all the way through to a final sale.
Here’s a simple visual of how that works:
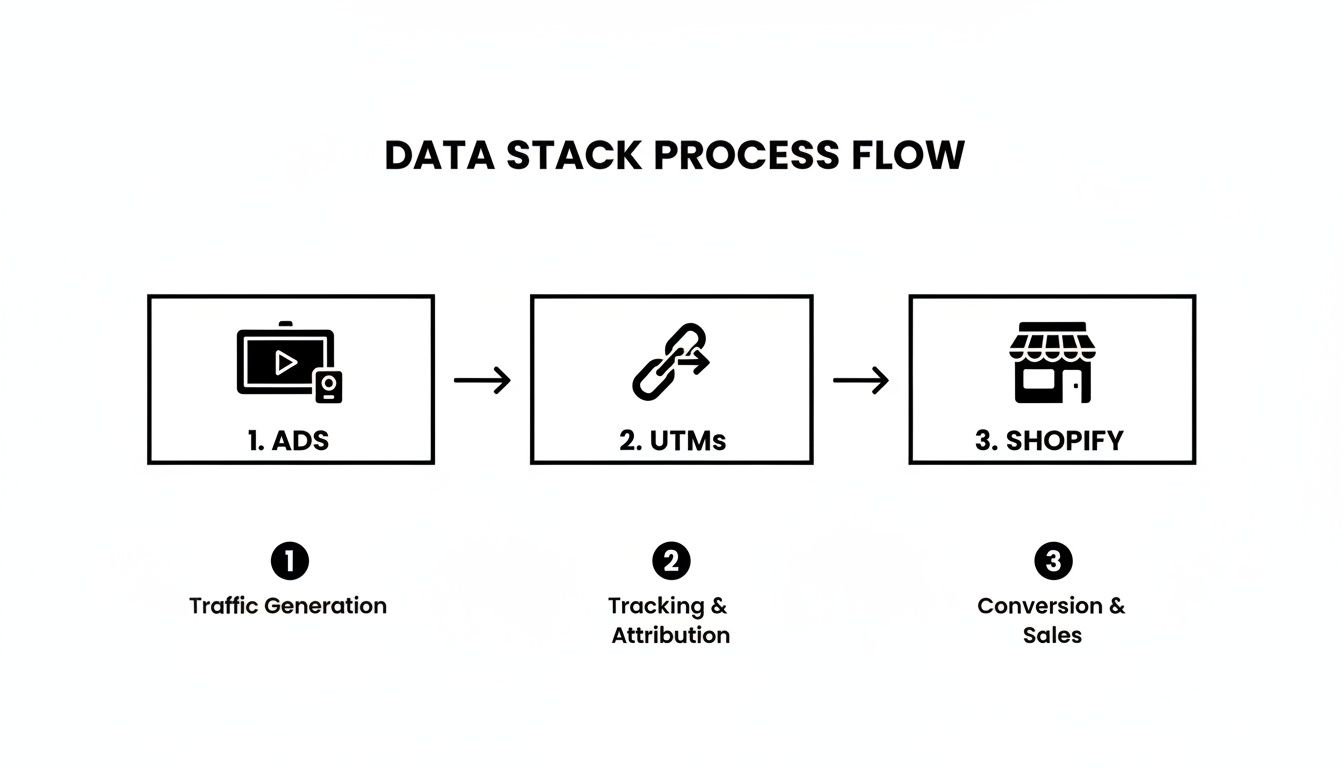
As you can see, disciplined UTM tracking is the critical bridge that links what happens on Facebook or Google Ads to the real transactions in Shopify. This is what unlocks SKU-level analysis.
Deconstructing the Costs of a Sale
To get to your true profit per order, you have to subtract all the associated costs from the revenue that order generated. The key here is to be ruthless—don't leave anything out.
Your calculation needs to include these four pillars:
Cost of Goods Sold (COGS): This is the direct cost to produce the item, from raw materials to manufacturing.
Ad Spend: The marketing cost you can attribute to that specific sale.
Transaction Fees: The cut that Shopify Payments or other processors take (usually around 2.9% + 30¢).
Fulfillment & Shipping Costs: What it costs your team or 3PL to pick, pack, and ship the order.
By meticulously tracking these four core costs against the revenue from each order, you move from a vague "blended ROAS" to a precise, actionable net profit figure. This completely changes how you see your business's performance.
Once you have this data, you can finally see which campaigns, ad sets, and even individual products are your real profit drivers.
The Margin Illusion ROAS Creates
Let me walk you through a classic scenario that traps so many Shopify store owners. Imagine you're selling two different products, and both are getting sales from your Meta campaigns.
Product A: The High ROAS "Hero"
Revenue: $100
Ad Spend: $25
Platform ROAS: 4.0x
COGS: $60
Fees & Shipping: $10
Total Costs: $95 ($25 + $60 + $10)
Net Profit: $5
Product B: The Underestimated Performer
Revenue: $100
Ad Spend: $40
Platform ROAS: 2.5x
COGS: $25
Fees & Shipping: $10
Total Costs: $75 ($40 + $25 + $10)
Net Profit: $25
At first glance, Product A's 4.0 ROAS looks amazing. But because its product margin is so thin, you're barely making any money. Meanwhile, Product B's "worse" 2.5 ROAS is actually delivering 5x more profit to your bottom line.
This is the exact kind of insight that platform metrics completely hide. If you want to play around with your own numbers, our break-even ROAS calculator is a great tool for setting profit-driven targets.
This SKU-level analysis is the foundation for scaling profitably. It gives you the power to stop funding campaigns that look good on the surface but are actually losing you money, and instead, double down on the products that are your true financial workhorses. That's how you build a sustainable and genuinely profitable return on Shopify.
A Daily Workflow for Systematically Improving ROAS

Once your data is clean and reliable, you can finally stop making gut decisions and start operating with real confidence. The difference between a reactive marketer and a strategic one often comes down to a repeatable daily workflow. It’s all about creating a system that consistently improves your return on Shopify, replacing frantic, last-minute tweaks with a prioritized plan.
This isn’t about gluing your eyes to the ad manager for hours, panicking over every little dip. It's a focused, deliberate routine. The goal is to spot real problems, jump on genuine opportunities, and—just as crucial—know when to leave things alone so the algorithms can do their work.
Diagnosing Underperforming Ads
First things first: you need to find the ads that are burning through your budget without pulling their weight. Don't just see a low ROAS and instinctively hit the "off" button. The key is to dig in and understand why it's not performing.
Start by looking for the usual suspects:
Creative Fatigue: Is your ad frequency creeping up while your Click-Through Rate (CTR) is tanking? That's the textbook sign that your audience has seen your ad too many times. A frequency north of 3-4 in a tight window usually means it's time to swap in fresh creative.
Audience Saturation: Watch your Cost Per Mille (CPM). If it’s steadily climbing for a particular audience, you might be running out of new people to reach. The ad platform is essentially charging you a premium to show your ad to the same people over and over.
Offer Mismatch: Are you getting a fantastic CTR but a terrible conversion rate on your site? This classic disconnect means your ad is making a promise that the landing page isn't keeping. For a deeper dive, check out our guide on improving your website conversion optimization.
This daily check-in takes you from simply reacting to a bad number to investigating the root cause. That's where smart, effective decisions come from.
Making Smart Budget Decisions
After you’ve diagnosed the problem children, your next move is to allocate your budget more effectively. This isn’t about making massive, sweeping changes every single day. Think of it more like steering a ship with small, data-informed course corrections.
Your daily workflow should be a filter, not a fire hose. The aim is to identify the one or two highest-impact actions you can take today and ignore the rest of the noise. Over-editing campaigns can reset the learning phase and hurt performance more than it helps.
Here’s a simple framework I use for managing daily budgets:
Scale the Winners: If an ad set is consistently crushing your target ROAS and still has room to grow (meaning the audience isn't saturated), give it a small budget bump. A 15-20% increase is usually the sweet spot to avoid shocking the algorithm.
Cut the Losers: For ads that are clearly underperforming based on your diagnosis (not just one off day), it’s time to cut your losses. Take that money and put it toward your proven winners or use it to fund new creative tests.
Let It Ride: What if performance is stable and hitting your goals? Do nothing. Seriously. Resisting the urge to constantly tinker is one of the most underrated skills in this game.
This disciplined approach ensures you’re methodically shifting your ad spend from unprofitable activities to profitable ones. By focusing on the true drivers of performance—creative, audience, and offer—you build a powerful feedback loop that steadily lifts your overall return on Shopify.
Advanced Diagnostics for Scaling Your Ad Spend
When you start to really pump cash into your campaigns, the entire game changes. What got you from zero to $100 a day in spend often falls apart on the way to $1,000 a day. Scaling successfully isn’t just about bumping up the budget; it’s about having a solid diagnostic system in place to protect your return on Shopify before the whole thing goes sideways.
You have to get good at spotting the early warning signs of decay. These are the subtle, leading indicators that pop up long before your ROAS takes a nosedive. Think of them as the check-engine light for your ad account.
Keep a sharp eye on metrics like a rising Cost Per Mille (CPM) or a declining Click-Through Rate (CTR). A creeping CPM means it's getting more expensive just to get eyeballs on your ads. A falling CTR suggests your creative is losing its punch. Another huge red flag is high ad frequency—a sure sign you're hammering the same audience over and over, leading to inevitable creative fatigue.
The Hidden Danger of Edit Velocity
One of the single biggest mistakes I see operators make when scaling is freaking out over every minor dip. This knee-jerk reaction leads to what we call high edit velocity—making far too many changes, far too quickly. Every time you tweak a budget, fiddle with an audience, or swap a creative, you risk knocking the ad platform's learning phase off-kilter, which just creates more instability.
Constant, reactive edits are the enemy of stable scaling. The algorithm needs consistent data to do its job. If you’re always changing the inputs, you're essentially hitting the reset button on its progress and preventing it from ever finding a stable rhythm.
Instead of making impulsive adjustments, set a clear threshold for when you'll actually intervene. You have to give the data time to mature, usually a few days, before you can make an informed call. This kind of discipline is what stops you from over-managing your campaigns right into the ground.
Building Proactive Guardrails
To scale with any real confidence, you need a system that flags risks before they turn into budget-draining disasters. It all comes down to building guardrails around your ad spend that keep performance on the right track.
Here’s what to look for:
Audience Overlap: Are your different ad sets cannibalizing each other by competing for the same users? Most ad platforms have a built-in tool to check for this. High overlap jacks up your costs and makes it impossible to know which campaign is actually doing the heavy lifting.
Premature Scaling: Are you trying to throw money at a campaign that isn't truly profitable yet? Before you even think about increasing the budget, make absolutely sure your SKU-level profitability is solid and the campaign has delivered consistent results for at least 5-7 days.
Adopting this proactive mindset is what separates sustainable growth from a flash in the pan. It's an approach that's mirrored by the very platform you're building on. Just look at Shopify's own revenue growth, which consistently hits the 25-32% range year after year. That shows a deep commitment to building a reliable infrastructure for merchants. This backend stability and ongoing investment in better features directly reduce friction for your customers, which in turn helps your conversion rates and bolsters the ROI from your ad campaigns. You can read more about Shopify's financial momentum and what it means for merchants.
By keeping a close watch on these advanced diagnostics, you can shift from constantly putting out fires to proactively managing growth. That's how you pour fuel on what's working without getting burned.
Let's Tackle Your Biggest Questions About Shopify Profitability
When you're running a Shopify store, it's easy to get bogged down in the numbers. I've seen countless founders get tripped up by the same financial questions, so let's cut through the noise and get to what really matters for your store's growth.
The most common mistake? Mixing up ROAS with actual profit. Return on Ad Spend (ROAS) is a simple, top-line metric: revenue divided by ad spend. But your real return on Shopify—the number that actually pays the bills—has to factor in all the other costs that come with making a sale. We're talking Cost of Goods Sold (COGS), those pesky transaction fees, and shipping expenses. Only then do you see your true net profit.
So, What’s a “Good” ROAS on Shopify?
Honestly, there's no single magic number. A "good" ROAS is completely tied to your product's profit margins.
Think about it: a brand with cushy 80% margins could be swimming in profit with a 2.0 ROAS. On the flip side, a store with tighter 30% margins might actually be bleeding cash at a 4.0 ROAS.
The question you should be asking isn't "What's a good ROAS?" Instead, ask, "What is my break-even ROAS?" Once you know the absolute minimum you need to hit just to cover your costs, you can finally set performance targets that guarantee you're profitable with every single order.
How Much Are Returns Really Costing Me?
Returns are a quiet killer of profitability. They aren't just an inconvenience; they directly drain your bank account. In 2024, the average ecommerce return rate hit a staggering 16.9%, which is a massive chunk of potential profit just vanishing.
When a customer sends something back, it triggers a chain reaction of costs that go far beyond just the lost sale.
You’re losing money from every angle:
Original Shipping: That money is gone for good.
Return Shipping: You’re likely paying for the product's trip back to your warehouse.
Processing & Restocking: It takes time and labor to inspect the item, update inventory, and put it back on the shelf.
Damaged Goods: The product might come back unsellable or need to be discounted.
One return can easily erase the profit you made from several other successful sales. This is why focusing on minimizing returns—with things like better product photos, detailed descriptions, and accurate sizing guides—is one of the most powerful things you can do to boost your overall return on Shopify. It’s a critical piece of your financial puzzle that too many store owners overlook.
Ready to stop guessing and start executing with confidence? SpendOwlAI delivers a prioritized daily action plan, turning noisy ad data into clear, profit-driven decisions for your Shopify store. Get your free 7-day trial and see the difference.