The DTC Guide to Using a Break Even ROAS Calculator
Trusting the ROAS you see inside your Meta or Google dashboard is one of the fastest ways to lose money as a DTC brand. This is where your break-even ROAS (Return On Ad Spend) comes in. It's the precise point where revenue from your ads covers all the costs tied to that sale—ad spend, product costs, fees, everything—but hasn't turned a profit yet.
Think of it as your financial baseline. It’s the bright line separating campaigns that make you money from those that are just burning through cash.
Why Platform ROAS Is Misleading Your Ad Spend
Relying on the ROAS figure from your ad manager is a dangerous game. Why? Because platforms like Meta and Google only know two things: what you spent and the revenue their tracking pixels think they generated. This gives you a dangerously incomplete picture of your actual business health.
The ROAS metric you see in Ads Manager completely ignores your real profit margin. It has no clue about your Cost of Goods Sold (COGS), shipping costs, or the payment processing fees that take a bite out of every transaction. This is exactly how a campaign reporting a "good" 3.0x ROAS can secretly be losing you money with every sale.
The Real Cost of Inaccurate Metrics
Without knowing your break-even point, you’re flying blind. You might pour more budget into a campaign that looks like a winner on the surface, only to find out later it was killing your profit margin. On the flip side, you could pause a campaign that seems average but is actually profitable once you factor in your true margins. This is especially risky for campaigns stuck in the Facebook ads learning phase, where performance swings are common.
For years, a rule of thumb for e-commerce was a break-even ROAS somewhere between 3x and 4x. It's not just theory. A survey of ad agencies revealed that a staggering 68% of DTC founders overspent simply by not knowing their actual break-even points. They wasted an average of 25% of their ad budgets on campaigns that were running below this critical profitability floor.
Your Financial Guardrail for Smart Scaling
Your Break-Even ROAS (which we'll call BER) is your ultimate financial guardrail. It’s the non-negotiable floor. Every ad set, every campaign, and every channel must perform above this number to even be considered for scaling.
Knowing this single metric transforms your ad management from gut-feel guesswork into a data-backed financial strategy. It gives you the clarity to make confident decisions about where to put your budget for the biggest impact.
Instead of just chasing higher top-line revenue, you can start focusing on driving truly profitable growth. It's the first—and most important—step toward making every dollar of your ad spend accountable and ensuring your scaling efforts actually build your bottom line.
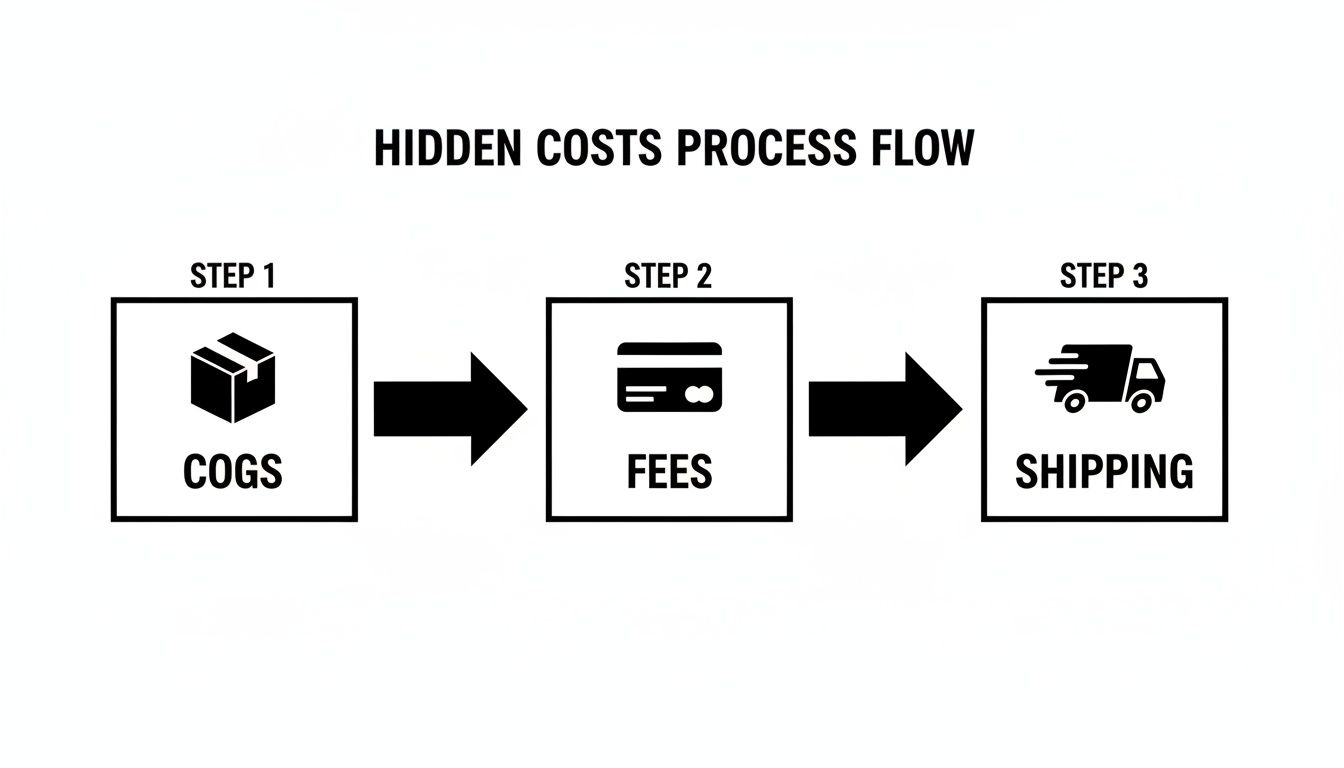
Finding All the Hidden Costs That Eat Into Your Profit
To get a truly useful break-even ROAS, you have to look past the most obvious expense—your Cost of Goods Sold (COGS). A reliable calculation means digging into all the variable costs that quietly take a slice of your profit from every single order. If you ignore them, you're flying blind, thinking ad campaigns are winners when they might actually be losing you money.
It’s easy to focus on the big numbers, but the small, forgotten costs are what separate a profitable business from one that’s just spinning its wheels. Let's break down where to find them.
More Than Just the Product Cost
The first place to look is at payment processing fees. Every time a customer pays you, platforms like Shopify Payments or Stripe take their cut. A standard fee like 2.9% + $0.30 per transaction doesn't sound like much, but it adds up fast, especially as you scale.
Next up are the costs of getting the product into your customer's hands. Shipping and fulfillment are moving targets; they change based on package weight, the customer's location, and even carrier surcharges during the holidays. You can't just plug in a single number and call it a day. The smart move is to calculate a blended average cost per order.
I see this all the time: founders only factor in their product cost and ad spend. But if you have a 5% return rate and a 3% payment processing fee, you’ve already lost 8% of your revenue before you even think about putting the item in a box. These "small" costs create massive blind spots.
And don't forget the box itself! The physical materials you use for shipping—branded mailers, packing tape, tissue paper, thank-you cards—all have a cost. That custom mailer might only be $1.50, but that single expense can completely change your break-even point on a low AOV product.
Factoring in Returns and Shaky Attribution
Returns are a direct punch to your profit. Depending on what you sell, an average e-commerce return rate can be anywhere from 5% to 15%. You paid to acquire that customer and ship them the product, and now the revenue from that sale is just gone. You absolutely have to account for this percentage in your cost structure.
Finally, think about your ad attribution. If you're just looking at what the ad platforms tell you, you're getting a skewed picture. Every platform wants to take credit for the same sale. For a much deeper look at getting cleaner data, our guide on using UTM parameters for Google Analytics is a great place to start.
To make this easier, here's a quick checklist of the key variables you need to pull together before plugging anything into a calculator.
Key Inputs for Your Break-Even ROAS Calculation
Use this checklist to gather all the necessary variables for an accurate calculation, complete with typical examples for a DTC product.
Input Variable | Description | Example Value |
|---|---|---|
Cost of Goods Sold (COGS) | The direct cost to produce or acquire one unit. | $15.00 |
Payment Processing Fees | The percentage and flat fee from your payment gateway. | 2.9% + $0.30 |
Avg. Shipping & Fulfillment | Your blended average cost to pick, pack, and ship. | $8.50 |
Packaging Costs | The per-order cost of all your shipping materials. | $1.50 |
Average Return Rate | The percentage of orders returned for a refund. | 8% |
Getting these numbers right is the most important part of the entire process. It’s what takes you from looking at surface-level ad metrics to truly understanding the financial health of your business.
How to Calculate Your Break-Even ROAS
Alright, you've done the hard work of digging up all those hidden costs. Now, let's put them to use and figure out the single most important metric for your ad accounts. The good news? The math itself is actually pretty simple. It all boils down to knowing your true profit margin on every single order.
The formula you'll live by is this:
Break-Even ROAS = 1 / Profit Margin
The only catch is that "Profit Margin" has to be spot-on. We're not talking about a vague sense of profit. It has to be the money left over after every single one of those variable costs we just talked about gets taken out. This is what makes the formula work for your business, not just in a textbook.
Putting It All Together: A Real-World Example
Let's walk through a tangible example. Say you're running a Shopify store and your hero product is a premium skincare serum that sells for $50.
First, we need to find that true profit margin. Here’s the breakdown:
Revenue: $50.00 (what the customer pays)
Subtract COGS: $10.00 (what it costs to make the serum)
Subtract All Other Costs:
Payment Processing (2.9% + $0.30): $1.75
Shipping & Fulfillment: $7.50
Packaging: $1.50
Each of these costs eats away at your revenue before you ever see a dime of profit.
Add up all those variable costs, and you get $20.75 for this one order ($10.00 + $1.75 + $7.50 + $1.50).
Now we can figure out the actual profit left in your pocket:
$50.00 (Revenue) - $20.75 (Total Costs) = $29.25 (Profit)
With that, we can finally calculate the profit margin:
$29.25 (Profit) / $50.00 (Revenue) = 0.585 or 58.5%
Now for the final step. We just plug that margin into our main formula:
Break-Even ROAS = 1 / 0.585 = 1.71x
That’s your number. 1.71x.
It means for every $1 you pump into ads, you need to get at least $1.71 back in sales just to cover your costs and break even. Anything above that is pure profit.
This is the exact method savvy e-commerce teams and agencies use to protect their margins. Sadly, industry data suggests about 40% of advertisers don't account for all these variables, which leads to a staggering amount of wasted ad spend. You can learn more about how this simple formula is a game-changer at breakevenroascalculator.com. Once you have this number, you can finally manage your ad accounts with confidence, knowing exactly where the floor is.
Using the Interactive Break-Even ROAS Calculator
Alright, enough with the theory. Let's get our hands dirty and figure out the exact ROAS your brand needs to hit to actually be profitable.
I’ve built a free, interactive calculator for you below, designed specifically for DTC brands. We’ll walk through a few different real-world scenarios to show you just how much your profitability threshold can swing based on your numbers.

This little tool is your first step to stop guessing and start managing your ad spend with real confidence. Go ahead and plug in your own numbers to follow along.
Scenario 1: High-Margin Skincare Brand
Let's kick things off with a classic DTC example: a high-margin vitamin C serum. The product is lightweight and the brand has some solid supplier rates locked in, giving it a healthy profit buffer.
Here’s what we’ll punch into the calculator:
Product Selling Price: $75.00
Cost of Goods Sold (COGS): $12.50
Average Shipping Cost: $6.50
Payment Processing Fee: 2.9%
Miscellaneous Costs (packaging, inserts): $2.00
After entering these values, the calculator spits out a clear result.
Resulting Break-Even ROAS: 1.48x
That number, 1.48x, is this brand’s financial floor. For every dollar they put into ads, they need to get at least $1.48 back in revenue just to cover all their costs. Anything above that is pure profit, which gives them a massive runway for scaling aggressively on platforms like Meta and Google.
Scenario 2: Low-Margin Dropshipped Gadget
Now, let's flip the script and look at the other end of the spectrum. Picture a dropshipping store slinging a popular tech gadget. The market is absolutely brutal, margins are paper-thin, and every single percentage point counts.
Here’s the financial reality for this kind of product:
Product Selling Price: $40.00
Cost of Goods Sold (COGS): $20.00 (a much bigger slice of the price)
Average Shipping Cost: $8.00 (it's a heavier item)
Payment Processing Fee: 2.9%
Miscellaneous Costs (minimal packaging): $0.50
The cost structure is worlds apart, and so is the outcome.
Resulting Break-Even ROAS: 3.86x
With a break-even ROAS of 3.86x, this business has virtually no room for error. A campaign that’s showing a 3.5x ROAS in Ads Manager might look pretty decent on the surface, but it's actually losing money on every sale.
This is exactly why knowing your break-even number is so critical. Low-margin businesses have to be incredibly disciplined. It's a truth echoed by industry experts; guides from platforms like Nozzle.ai have shown that for a business with a 20% profit margin, a platform-reported 2x ROAS can easily be an unprofitable 0.4x effective ROAS. As you can imagine, understanding how skyrocketing ad costs impact ROAS targets on Nozzle.ai is more important than ever for survival.
Scenario 3: Product on Promotional Discount
Finally, what happens when our high-margin skincare brand decides to run a 20% off flash sale? The idea is to drive a ton of volume and bring in new customers, but what does that do to their break-even point? The costs are fixed, but the revenue from each order takes a hit.
Let's tweak the inputs:
Product Selling Price: $60.00 (down from $75)
COGS, Shipping, Fees, Misc. Costs: All stay the same as our first scenario.
That simple discount completely rewrites the financial equation.
Resulting Break-Even ROAS: 1.76x
Just like that, the break-even point jumped from 1.48x to 1.76x. This means their ad campaigns need to perform nearly 20% better just to break even during the sale. The marketing team absolutely has to know this new, higher target to figure out if the promotion is a true win or just an exercise in generating revenue while bleeding profit.
Putting Your Break-Even ROAS to Work in Google and Meta Ads
Figuring out your break-even number is a fantastic start, but the real magic happens when you actually use it inside your ad accounts. This one number completely changes how you manage campaigns, pulling your focus away from vanity metrics and locking it onto real, tangible profit. The goal isn't just knowing the number; it's about using it to make smarter, faster decisions in your Meta and Google Ads campaigns.
Think of your Break-Even ROAS (BER) as the zero-degree mark on a thermometer. Any campaign running colder than that is actively losing you money. Anything running hotter is making you money. It’s that simple, and that clarity lets you stop guessing and start managing your budget with total precision.
Setting Smarter Target ROAS Goals
Your BER is your floor, not your ceiling. To set a Target ROAS (tROAS) that actually grows your business, you need to layer your desired profit margin right on top of that break-even foundation.
Let's imagine your break-even ROAS calculator spits out a BER of 2.5x. If you run your campaigns at exactly 2.5x, you're just paying the bills—no harm, but no growth, either. If you're aiming for a healthy 20% net profit margin, you’ve got to aim higher.
Here’s a practical way to think about your campaign tiers:
Break-Even Tier: A ROAS of 2.5x is the bare minimum. Campaigns living here are paying their own way but aren't adding a dime to your bottom line.
Profit Tier: Pushing for a 3.5x tROAS starts to build a nice profit buffer. This should be your new benchmark for a healthy, scalable campaign.
High-Growth Tier: Anything hitting 4.5x ROAS or more is a certified winner. These are the campaigns you want to feed with as much budget as they can handle.
When you set your tROAS goals this way, you're sending a crystal-clear signal to the ad platforms' bidding algorithms. You’re telling them exactly what a valuable conversion looks like for your business, guiding them toward the outcomes you actually want. For a deeper dive into structuring your accounts for success, our guide can help you improve your Google Ads performance.
Using Your BER as a Performance Guardrail
Your BER is also your most critical safety net. It’s the non-negotiable performance floor that tells you when it’s time to act—fast. You can even set up automated rules in both Google and Meta to keep an eye on things for you.
A great example is setting up a rule to automatically pause any ad set that dips below your 2.5x BER after spending a specific amount, like $100. This simple automation stops a bad ad from quietly bleeding your budget dry.
This approach builds a financial backstop right into your accounts. It gives you the confidence to test new creative, experiment with new audiences, and take calculated risks, all because you know you have a system ready to cut your losses automatically.
Ultimately, it frees you up. Instead of spending your days micromanaging every campaign, you can focus on the bigger picture—strategy, growth, and finding your next winning ad. By confidently shifting budget away from what's not working and doubling down on what is, you make sure every single dollar is fighting for your bottom line.
Common Questions We Hear About Break-Even ROAS
Once you've crunched the numbers and found your break-even point, the real questions start popping up. Getting these details right is what separates a decent ad strategy from one that actually drives profit. Let's walk through some of the most common things people ask when they start putting their break even roas calculator to work.
Nailing these nuances is how you go from theory to confidently making better financial decisions for your brand.
How Often Should I Recalculate This?
Think of your break-even ROAS as a living number, not something you set once and forget. Any time your core business costs change, you need to revisit it. This could be a price hike from your supplier (your COGS just went up), new shipping rates, or even a small tweak to your payment processor's fees.
It’s especially important to run the numbers before any big sale or promotion. That 20% off sale you're planning? It directly slashes your revenue per sale, which means your required ROAS will have to be higher to compensate. A good rule of thumb is to review it quarterly, and always before any major campaign where your costs or pricing change.
What’s a Good Target ROAS to Aim For?
This is a "how long is a piece of string" question, but I can give you a solid framework. Your target ROAS depends entirely on your profit goals. A great place to start is aiming for a 15-25% net profit margin after your ad spend is accounted for.
So, let's say your break-even ROAS is 2.5x (which means you have a 40% margin before ad costs). Setting your target ROAS somewhere around 3.5x or 4.0x builds in that healthy profit buffer. The key is to set your target based on your financial goals, not some generic benchmark you read in a blog post.
Should I Have Different Targets for Different Products?
Yes, one hundred percent. This is where you get into the big leagues of ad account management. Every single product has its own unique cost structure and profit margin, which means each one has its own break-even ROAS.
Setting product-specific break-even and target ROAS goals is a game-changer for budget allocation. It’s a crucial step that stops you from accidentally using the profits from your hero products to subsidize your losers.
How Does Customer Lifetime Value (LTV) Fit In?
Okay, this is a more advanced tactic, but it’s incredibly powerful. The standard break-even ROAS calculation is all about getting profitable on that first purchase. But what if you have solid data showing your customers come back again and again?
If you know your Lifetime Value (LTV), you can be more strategic. A business with a high LTV might be perfectly happy to acquire a new customer at break-even, or even at a slight loss. Why? Because they know, with confidence, that the real profit will come from the second, third, and fourth purchases. This approach requires a rock-solid handle on your LTV data, but it unlocks a much more aggressive, long-term growth strategy.
Stop guessing and start executing with clarity. SpendOwlAI delivers a ranked list of what to change in your ad accounts today, turning noisy data into clear actions. Start your free 7-day trial and see the difference.