Your Guide to KPI E Commerce for Sustainable Growth
If you’re running an e-commerce brand, you know a great product is just the starting line. Real, lasting growth isn't about guesswork; it’s about knowing your numbers inside and out. We’re talking about Key Performance Indicators (KPIs), and they’re not just confusing acronyms. They’re the most powerful tools you have for scaling your business.
This guide will break down the essential kpi e commerce metrics and turn them into a practical playbook for growth.
Why You Can't Afford to Ignore Your KPIs

Trying to grow a store without tracking KPIs is like flying a plane without an instrument panel. You might feel like you're moving forward, but you have no real idea of your altitude, speed, or direction. Are you climbing, or are you in a nosedive?
KPIs are your instruments. They translate vague goals like "get more sales" into a clear, actionable dashboard. They give both direct-to-consumer (DTC) founders and marketers a shared language to diagnose problems, pinpoint what’s working, and make confident decisions that actually move the needle.
From Data Overload to Decisive Action
Let’s be clear: the e-commerce world is bigger and more competitive than ever. Global sales hit an incredible $6.09 trillion in 2024 and are on track to reach $9.4 trillion by 2026. That’s a massive pie, but everyone wants a slice. The data shows that businesses that consistently monitor their performance see 23% higher revenue growth than those flying blind.
Good KPIs cut through the daily chaos and show you the story behind your sales. Instead of just seeing a revenue number at the end of the day, you can finally answer the questions that matter:
Where are my most valuable customers really coming from?
How much am I paying to get each new customer in the door?
Which of my products are driving the most profit?
Is my ad spend actually making me money?
Answering these questions isn't just a "nice-to-have"—it's how you build a business that lasts. It lets you put your limited time and money where they'll have the biggest impact. Understanding how to connect these metrics to your marketing efforts is a critical first step. For a deeper look, check out our guide on data-driven marketing solutions.
Think of KPIs as your business’s vital signs. Just as a doctor checks heart rate and blood pressure to assess a patient's health, e-commerce operators use KPIs to measure the health and performance of their store. They provide an objective look at what’s happening under the surface.
This guide is your roadmap to mastering the most important kpi e commerce metrics. We'll break down what each one means, show you how to calculate it, and—most importantly—explain how it connects to the decisions you make every single day. By the end, you'll have a clear framework for turning your store’s data into profitable growth.
Understanding Your Core Business Health Metrics

Alright, let's get out of the clouds and into the engine room of your store. The most critical kpi e commerce metrics are your high-level dashboard, giving you a real-time read on your business’s health and potential for growth. If you don't understand these, you're flying blind.
I like to think of an e-commerce business as a high-performance vehicle. Each core metric is a vital component, and they all have to work in sync. A problem with one will absolutely drag down the others, putting the brakes on your progress.
We’re going to focus on the four foundational gauges you need to watch: Conversion Rate (CVR), Average Order Value (AOV), Customer Acquisition Cost (CAC), and Customer Lifetime Value (CLTV). For each one, I’ll give you the formula, some current benchmarks, and why it's so important for your strategy.
Conversion Rate (CVR): Your Engine's Efficiency
Your Conversion Rate is simply the percentage of visitors who take the action you want them to—in our case, making a purchase. It’s the clearest measure of how well your website, product pages, and checkout actually persuade people to buy.
Formula: (Number of Sales / Number of Website Visitors) x 100 = CVR (%)
A low CVR points to friction somewhere in the process. Maybe your site is sluggish, your offer isn’t clear, or the checkout is a pain to get through. This is your engine's raw efficiency; it doesn't matter how much traffic (fuel) you pour in if a poorly-tuned engine can't turn it into speed (sales).
2026 Benchmark: A good CVR across most industries sits between 2% and 3%. The top-tier stores, however, are constantly tweaking and testing to push that number above 5%.
Average Order Value (AOV): The Fuel Per Stop
Average Order Value tells you the average dollar amount spent every time a customer completes an order. It's a direct look at how much value you're squeezing out of each transaction.
Formula: Total Revenue / Number of Orders = AOV
Increasing your AOV is one of the fastest ways to grow revenue without spending a dime more on advertising. Smart tactics like product bundles, upsells at checkout, or offering free shipping over a certain cart value are all designed to bump this number up. Think of it as the amount of fuel you get per stop; convincing customers to fill the tank a little more each time is way more efficient than constantly finding new customers.
2026 Benchmark: AOV is all over the map depending on the industry—it can be under $50 for cosmetics or well over $200 for high-end electronics. The real goal is to benchmark against your own history and push for steady, incremental growth.
Customer Acquisition Cost (CAC): The Price of Fuel
Your Customer Acquisition Cost is the total sales and marketing spend it takes to bring one new customer through the door. This metric tells you, in plain dollars, how much you're paying to get someone to make their very first purchase.
Formula: Total Marketing & Sales Spend / Number of New Customers Acquired = CAC
CAC is the price you pay for growth, plain and simple. If your CAC is higher than your AOV, you're lighting money on fire with every new customer—a business model that's headed for a cliff. A fundamental goal for any e-commerce brand is to drive CAC down while still attracting quality buyers. If you want to get this right, you can learn more about how to calculate your cost per acquisition in our deep-dive guide.
2026 Benchmark: CAC also varies wildly, but a healthy target for many direct-to-consumer brands is a 3:1 ratio of LTV to CAC. In other words, a customer should be worth at least three times what you paid to acquire them.
Customer Lifetime Value (CLTV): The Total Distance You Can Travel
Customer Lifetime Value is the grand total of all the revenue you can expect to earn from a single customer over their entire relationship with your brand. It’s the ultimate metric for measuring customer loyalty and the long-term viability of your business.
Formula: (Average Purchase Value x Average Purchase Frequency) x Average Customer Lifespan = CLTV
CLTV forces you to think beyond the first sale and focus on building a lasting relationship. It shows you the real, long-term worth of keeping your customers happy. When your CLTV is way higher than your CAC, you've built a profitable, sustainable machine. This is the total distance your vehicle can travel, proving the long-haul power of your business engine.
Decoding Your Advertising Performance
Pouring money into platforms like Meta and Google Ads without tracking the right metrics is a recipe for disaster. It’s like being a ship captain in a storm with no compass—you’re burning fuel, but have no idea if you’re heading toward profit or just deeper into the red. This is where your advertising kpi e commerce metrics come in; they are the instruments that dictate profitability.
Let's go beyond just memorizing the formulas for Return on Ad Spend (ROAS), Cost Per Acquisition (CPA), and Click-Through Rate (CTR). The real magic happens when you understand the story these numbers are telling. This is what separates campaigns that scale from budgets that get wasted.
Return on Ad Spend (ROAS): The Ultimate Ad Profitability Gauge
Return on Ad Spend is arguably the most critical metric for gauging the financial payback from your ads. It answers one simple question: "For every dollar I spend on ads, how much revenue do I get back?"
Formula: Total Revenue from Ads / Total Ad Spend = ROAS
A ROAS of 4:1, for instance, means you're making $4 in revenue for every $1 you spend. In a market expected to reach $6.42 trillion globally in 2025, knowing how your ad dollars translate directly to sales isn't just good practice—it's essential for survival. To dig deeper, you can explore more about what ROAS is in digital marketing.
But be careful. Chasing an astronomically high ROAS can be a trap. A sky-high ROAS often means you’re targeting such a tiny, specific audience that you’re leaving massive growth opportunities on the table.
Key Insight: A "good" ROAS isn't a one-size-fits-all number; it's entirely dependent on your profit margins. If your business runs on a 30% profit margin, you need a ROAS over 3.34:1 just to break even. Figure out your breakeven ROAS first, then you can set targets that actually build profit.
Cost Per Acquisition (CPA): How Much Are New Customers Really Costing You?
While ROAS looks at revenue, Cost Per Acquisition (CPA) zeroes in on what it costs to land a single new customer from your ads. It’s a more granular version of your overall Customer Acquisition Cost (CAC), but tied specifically to an ad campaign or channel.
Formula: Total Ad Spend on a Campaign / Number of New Customers from that Campaign = CPA
Knowing your CPA for each campaign gives you incredible leverage. If one ad set brings in customers for $20 and another costs $50, you know exactly where to shift your budget for better efficiency.
The story doesn't end there, though. A higher CPA isn't automatically bad if that campaign is attracting customers with a significantly higher Customer Lifetime Value (CLTV). It’s a balancing act. Paying more to acquire a customer who will spend three or four times that amount over their lifetime is a smart, sustainable way to grow.
Click-Through Rate (CTR): Your First Signal of Resonance
Your Click-Through Rate is the first sign of life for any ad. It measures the percentage of people who saw your ad and were intrigued enough to click. It’s your earliest feedback on whether your message and targeting are aligned.
Formula: (Total Clicks / Total Impressions) x 100 = CTR (%)
A low CTR is a huge red flag. It’s telling you that either your ad is failing to grab attention or you're showing it to the wrong crowd.
Creative Problem: Your visuals might be bland, your headline weak, or your offer isn't compelling enough to stop the scroll.
Audience Problem: You could be targeting a group of people who simply have no interest in what you're selling.
CTR is the very first domino in your sales funnel. You can have the world's best product and a perfect landing page, but if nobody clicks your ad, none of it matters. Keep a close eye on your CTR to fix problems at the top of your funnel before they drain your entire budget.
Driving Profitability with Retention and Loyalty Metrics
Getting that first sale is a huge win, but it’s just the beginning. The real, sustainable profit in e-commerce comes from turning that one-time buyer into a lifelong fan. This is where we look past the initial acquisition and focus on the kpi e commerce metrics that measure customer loyalty.
These numbers tell you if you've built a brand people want to come back to, or if you're stuck on a treadmill of constantly paying for new customers. Let’s dive into Cart Abandonment Rate, Customer Retention Rate, and Repeat Purchase Rate—the core metrics for building a resilient business.
Diagnosing the Leaky Bucket with Cart Abandonment Rate
There’s almost nothing more frustrating than seeing shoppers fill their carts only to disappear without a trace. That’s your Cart Abandonment Rate in action. It’s the percentage of people who add products to their cart but bail before paying.
Formula: (1 - (Completed Purchases / Carts Created)) x 100 = Cart Abandonment Rate (%)
Think of it as a huge leak right at the very end of your sales funnel. With industry averages hovering around a staggering 70%, it’s a clear signal that something in your checkout experience is causing friction.
So, what’s tripping people up at the finish line? It usually comes down to a few common, and fixable, problems:
Unexpected Costs: High shipping fees or taxes that only show up at the last second are the number one reason for abandoned carts. Be upfront about all costs.
Forced Account Creation: Making someone create an account to buy is a well-known conversion killer. A guest checkout option is non-negotiable.
Complicated Checkout: If your checkout process feels long, confusing, or just a little shady, you’ll lose customers. Keep it simple, fast, and secure.
Plugging these leaks can give you an immediate revenue lift without spending a single extra dollar on ads.
Measuring Customer Loyalty with Retention Rate
While everyone loves talking about new customer acquisition, Customer Retention Rate (CRR) is where the most profitable brands are built. This KPI tells you what percentage of your customers stick around and buy from you again over a certain period. It costs far more to attract a new customer than to keep one, making retention an absolute powerhouse for your bottom line.
Formula: ((Number of Customers at End of Period - New Customers Acquired) / Customers at Start of Period) x 100 = CRR (%)
A strong CRR is a sign of a healthy brand with a great product-market fit. It means your customers are happy and they trust you, which naturally leads to a higher Customer Lifetime Value (CLTV).
It's a simple story: one brand focuses all its energy on acquisition, constantly churning through new customers. Another focuses on delighting its existing base, encouraging them to come back. Over time, the second brand will always build a more stable and profitable business because its growth isn’t totally dependent on expensive advertising.
Tracking Repurchase Behavior for Long-Term Growth
A close cousin to retention, the Repeat Purchase Rate (RPR) gives you a more direct look at customer loyalty. It simply measures the percentage of your customers who have bought from you more than once. It’s a great way to see if your efforts to create a positive post-purchase experience are actually working.
Formula: (Number of Customers Who Purchased More Than Once / Total number of Customers) x 100 = RPR (%)
When you see your RPR climbing, you know you’re doing something right after the first sale—whether it's your unboxing experience, your follow-up emails, or your loyalty program. These repeat buyers are your most valuable asset. They spend more over time and are far more likely to recommend you to friends, creating a word-of-mouth engine that fuels organic, profitable growth. Understanding these retention-focused kpi e commerce metrics is how you build a brand that lasts.
Turning Your KPI Data into Daily Actions
Knowing your numbers is the first step. But the real challenge—the one that separates thriving brands from struggling ones—is knowing what to do when those numbers change. There’s a huge gap between seeing a KPI on a dashboard and making the right call. This is where you graduate from simply watching your metrics to actively shaping your business strategy.
The tough part for any growth team is translating a KPI fluctuation into a specific, correct response. For instance, did your ROAS dip because your ad creative went stale, or is it because you’ve saturated your target audience? The knee-jerk reaction is often to start frantically tweaking campaigns. More often than not, this just makes things worse by resetting the ad platform’s learning phase.
From Raw Data to Ranked Actions
This is exactly the problem that modern execution systems are built to solve. Instead of just showing you that a metric changed, they explain why it changed and recommend what to do about it. Suddenly, ambiguous data becomes a clear, prioritized to-do list.
Take a system like SpendOwlAI. It doesn’t just report a ROAS number; it translates that data into ranked, human-readable actions. It can tell the difference between creative fatigue and audience saturation, giving you a precise recommendation. This helps you move from panicked guesswork to confident, data-backed decisions that protect your ad spend.
Think about conversion rate, one of the most vital kpi e commerce metrics. The average is a slim 2-3% across most online stores. To push this number up, 51% of e-commerce businesses are now turning to AI for personalization, which has been shown to boost sales by up to 59%. For a growth team, this means integrating tools that can spot fatigue and audience shifts. You can dive deeper into how AI is changing the game by exploring these global e-commerce statistics.
The Power of Smart Guardrails
A classic mistake we see operators make is over-editing. You spot a small dip in performance, panic, and immediately start changing bids, budgets, or ad copy. This constant tinkering creates a cycle of volatility and wasted spend, preventing your campaigns from ever hitting their stride.
Smart guardrails are the antidote. These are essentially automated checks designed to prevent common human errors. For example, a system might flag an ad set that's being edited too frequently. Or it might warn you before you scale a campaign that hasn't proven its stability yet.
The goal is to move from a state of constant reaction to one of intentional action. An execution system acts as a co-pilot, pointing out what needs attention and, just as importantly, advising on what to leave alone. This provides the restraint needed for long-term, stable growth.
This decision tree gives you a simplified visual for how to think about customer profitability. The path is completely different depending on whether you're dealing with a new or a returning shopper.
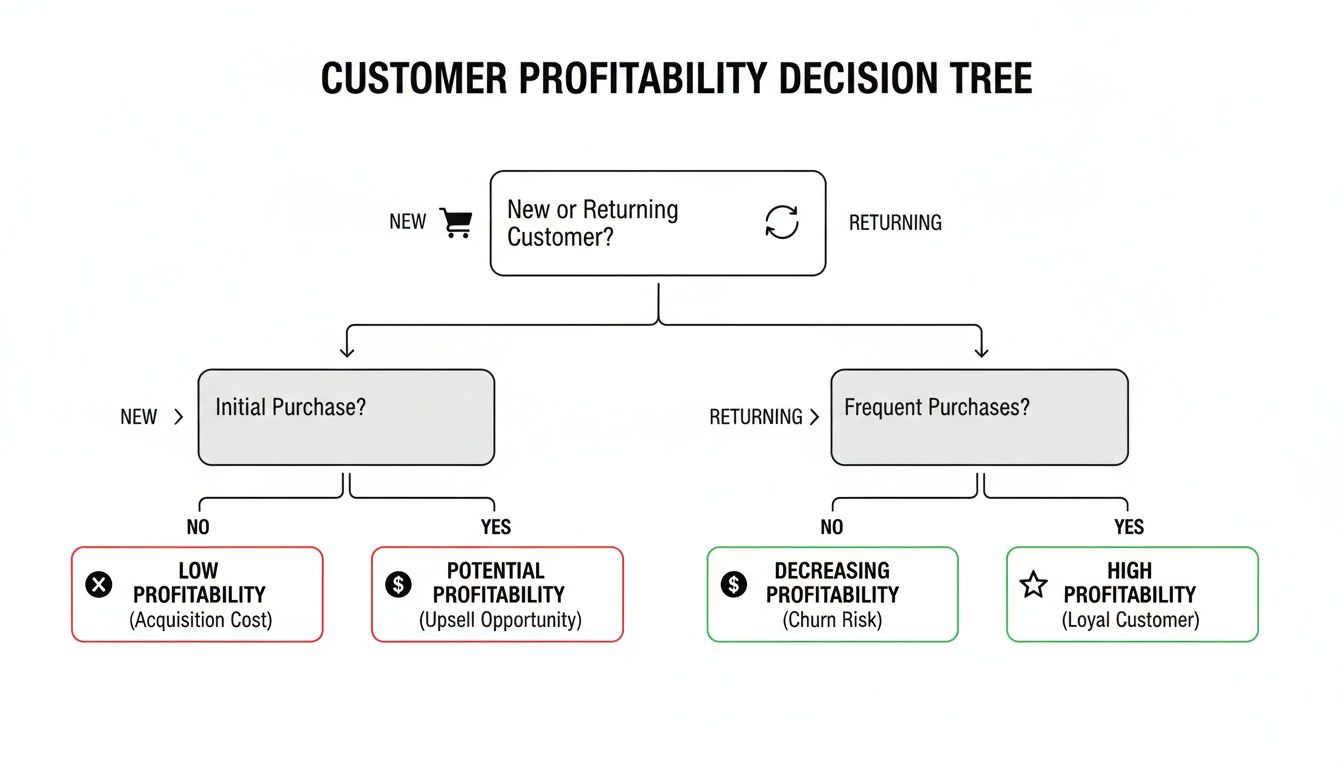
As you can see, you need distinct strategies for acquisition and retention to maximize profitability across your customer base.
KPI Change vs. Actionable Insight
The difference between a raw data point and a true insight is massive. A good execution system doesn't just report the "what"; it delivers the "why" and the "what next."
KPI Fluctuation | Typical Operator Reaction | SpendOwlAI's Ranked Action & Rationale |
|---|---|---|
ROAS dropped 15% overnight. | "Panic! This campaign is failing. Let's slash the budget or pause it immediately." | "Your ad frequency has spiked by 30% in the last 48 hours, indicating audience saturation. Action: Refresh creative for this ad set or launch a new lookalike audience to find fresh customers." |
Conversion Rate is down. | "Something must be broken on the website. Or maybe the ad is bad? I'll change the headline." | "Your Click-Through Rate (CTR) is stable, but Add-to-Cart rate has fallen 20% specifically on mobile devices. Action: Investigate the mobile user experience on your product page for friction." |
CPA is climbing steadily. | "This audience is too expensive now. Let's shut it down and move the budget elsewhere." | "Auction costs for this audience have increased 10% week-over-week. However, AOV from this segment is 25% higher than average. Action: Maintain budget but monitor NCPA (New Customer CPA) to ensure profitability." |
This table shows how context turns a scary number into a solvable problem. It’s about getting a specific diagnosis, not just a symptom.
Real-World Scenarios in Daily Workflow
Let's walk through how this plays out in a real-life scenario. Imagine your top-performing ad campaign sees its ROAS drop by 15% overnight.
The Gut-Feel Reaction: You immediately pause the campaign or slash its budget, assuming it's dead. You've just killed any chance of recovery and choked off your customer flow.
The Data-Backed Action: An execution system digs into the underlying data. It sees that CTR is stable, but your ad frequency has spiked and the conversion rate on the landing page has dipped.
The system's diagnosis isn't just "ROAS is down." It's "You're showing the same ad to the same people too often, and they're tuning it out." The recommended action isn't to kill the campaign—it's to refresh the creative and expand your audience targeting.
This surgical approach fixes the root cause without wrecking your momentum. By turning your kpi e commerce data into clear daily guidance, you build a more resilient and profitable advertising operation.
Your Questions About E-Commerce KPIs Answered
Knowing the definitions for a bunch of e-commerce KPIs is one thing. Actually using them to make smart, confident decisions every day? That’s a whole different ballgame. It’s completely normal for questions to pop up as you start digging into your store's data.
Let's move past the theory and tackle the practical side of things. Here are the answers to the most common questions we see from founders and marketers trying to build a KPI-driven strategy.
Which KPIs Should I Focus On When Starting Out?
When you’re just starting, the sheer number of metrics can be paralyzing. The secret is to tune out the noise and zero in on the handful of KPIs that directly signal whether your business is viable. Don't even think about tracking everything at once.
Instead, get a rock-solid handle on these three foundational metrics first:
Conversion Rate (CVR): This is your store’s pulse. It tells you, point-blank, if your products and website are compelling enough to turn browsers into buyers. A low CVR is a fundamental problem that no amount of ad money can solve.
Customer Acquisition Cost (CAC): You absolutely have to know what it costs you to land a new customer. If your CAC is higher than what they spend on their first purchase, you're losing money on every sale, and your business model is broken from the start.
Average Order Value (AOV): This is simply the average amount a customer spends in a single transaction. Finding ways to increase AOV, like product bundles or a free shipping threshold, is often the quickest path to growing revenue without needing more customers.
Once you feel confident you have a grip on these three, you can start layering in metrics like Return on Ad Spend (ROAS) and Customer Lifetime Value (CLTV).
How Often Should I Check My E-Commerce KPIs?
Finding the right reporting rhythm is crucial. If you check too often, you’ll end up making panicked decisions based on normal daily blips. But if you check too rarely, you’ll miss critical trends and leave money on the table.
A common mistake is treating every KPI the same. A daily drop in CLTV is meaningless noise, while a daily drop in ad spend could signal a serious issue. You need different timelines for different types of metrics.
Use this simple framework to get into a healthy monitoring cadence for your kpi e commerce data:
Daily Checks: Look at your leading indicators from the ad platforms—things like Ad Spend, Impressions, and Click-Through Rate (CTR). These are your early warning signals for immediate problems, like a disapproved ad or a broken link.
Weekly Reviews: This is the sweet spot for analyzing core performance metrics like ROAS, Cost Per Acquisition (CPA), and your overall Conversion Rate. A week gives you enough data to spot real trends and make course corrections to your campaigns.
Monthly Analysis: Dig into customer behavior metrics like Cart Abandonment Rate and Repeat Purchase Rate. These give you a more strategic view of your user experience and customer loyalty, helping you plan bigger-picture improvements.
Quarterly Deep Dives: This is the time to assess Customer Lifetime Value (CLTV). Since CLTV is a lagging metric that builds over a long period, a quarterly check-in is perfect for making long-term strategic decisions about retention and brand building.
My ROAS Is Low. What Should I Investigate First?
A low ROAS is a symptom, not the disease. Your job is to play detective and find the root cause, not just treat the symptom by killing the ad. When ROAS starts to fall, the problem almost always lives in one of three areas.
First, check your Click-Through Rate (CTR). A low CTR is a clear sign your ad creative, copy, or targeting just isn't connecting with your audience. If people aren't even clicking the ad, you have zero chance of making a sale.
Second, analyze your on-site Conversion Rate (CVR). Are you getting plenty of clicks but no sales? The problem probably isn't the ad itself, but what happens after the click. Look at your landing page speed, the clarity of your offer, or any friction in the checkout process.
Third, look at your Average Order Value (AOV). If your AOV has dropped, it will drag your ROAS down right along with it, even if your other rates are stable. Maybe a popular, high-priced item went out of stock, or a discount code is being used more than you expected.
A smart execution system helps you connect these dots automatically, pinpointing which lever is the real source of the problem so you can fix the right thing.
What Is Context Blindness in KPI Analysis?
Context blindness is one of the most dangerous—and expensive—mistakes you can make in e-commerce. It's what happens when you make a decision based on a single KPI in isolation, without understanding the full story behind the number.
For instance, an operator sees a campaign's ROAS dip and immediately shuts it down. What they missed was the context: the campaign was still in the ad platform's "learning phase," or it was acquiring new-to-brand customers with a very high predicted lifetime value. Killing that campaign was a costly error driven by incomplete data.
You beat context blindness by always asking "why" a metric changed and understanding how different KPIs influence each other.
This is exactly the kind of problem advanced systems are built to solve. They provide guardrails and explanations, telling you why a metric shifted and whether it's just statistical noise or a real signal that needs your attention. This prevents the kind of reactive, gut-feel decisions that destabilize ad accounts and burn cash.
By connecting your KPIs and understanding their relationships, you can move from making isolated guesses to executing a cohesive, intelligent growth strategy.
Ready to stop guessing and start executing with confidence? SpendOwlAI delivers a ranked list of what to fix in your ad accounts every day, complete with transparent rationale. Start your free 7-day trial and see what your data is really telling you.