What is roas in digital marketing: A Practical Guide to Ad Profitability
Think of ROAS—Return on Ad Spend—as the ultimate report card for your advertising. It cuts straight to the point and answers the one question that really matters: for every dollar I put into ads, how many dollars am I getting back?
It’s the clearest measure of whether your marketing is actually making you money or just costing you.
What Is ROAS and Why It’s a Big Deal for Ecommerce
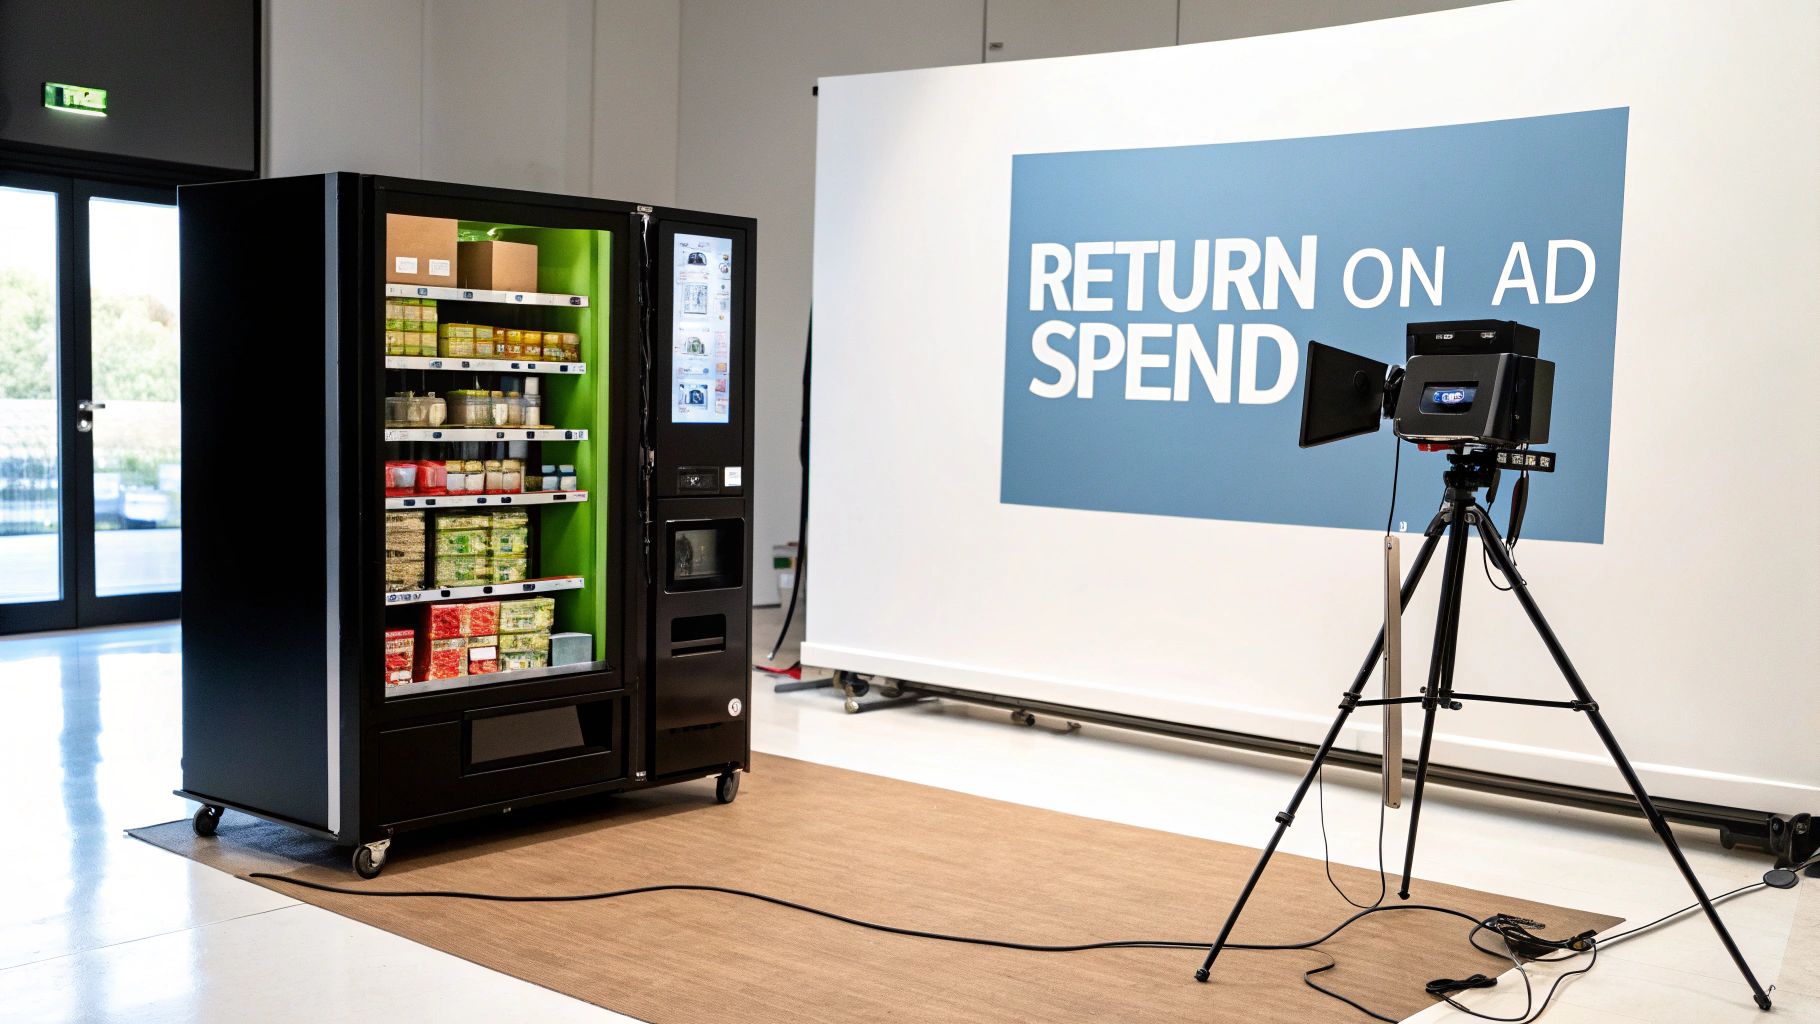
Let's use an analogy. Imagine your ad budget is the cash you're feeding into a vending machine. Each dollar you push into the slot should, hopefully, give you something back that's worth more than the dollar you spent. ROAS is the metric that tells you exactly how much value popped out for every coin you dropped in.
It filters out all the vanity metrics like clicks, impressions, and likes to give you a hard number on your financial return. For anyone running an ecommerce store on a platform like Shopify, knowing what is ROAS in digital marketing is absolutely essential. It’s your go-to health check for your ad campaigns—the first signal that tells you if your Facebook Ads, Google Shopping campaigns, or TikTok promos are fueling real growth or just draining your bank account.
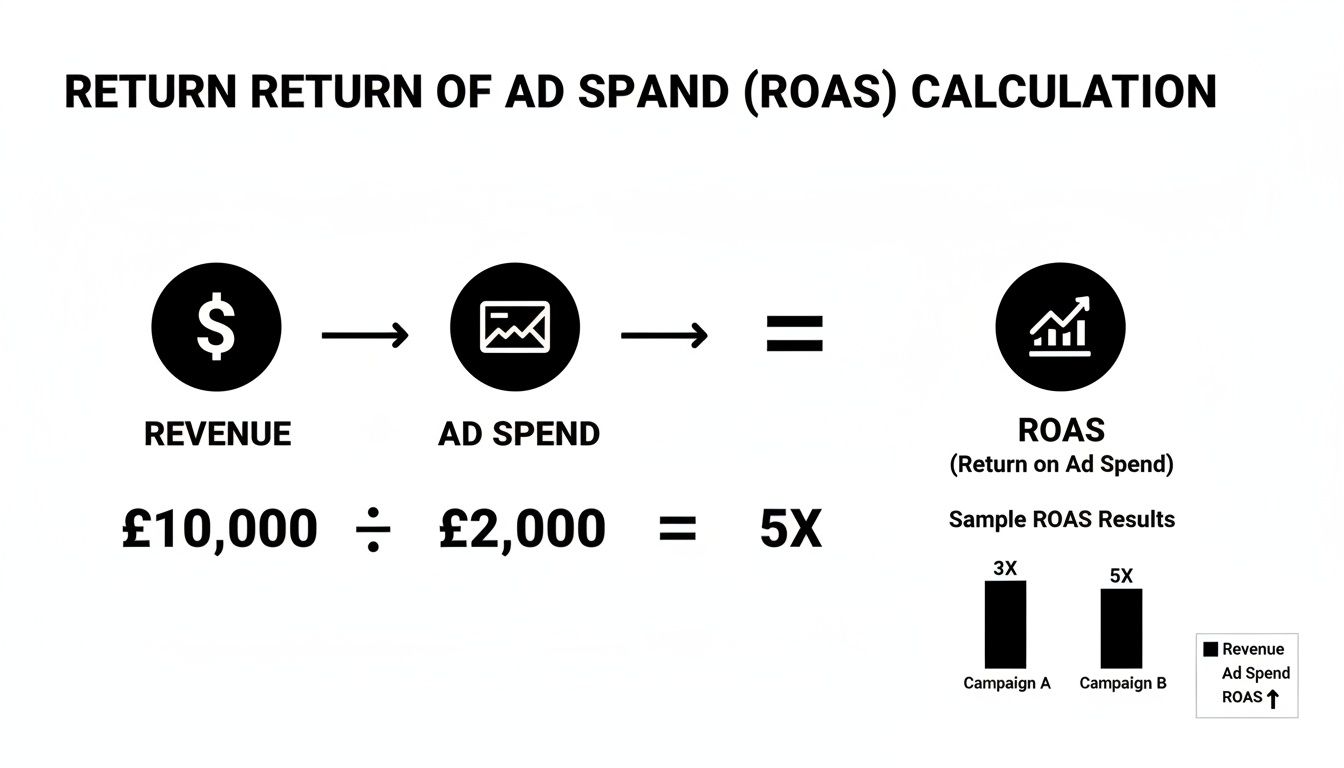
The Simple ROAS Formula
At its heart, the calculation is refreshingly simple. You just take the total revenue generated from your ads and divide it by what you spent to run them.
ROAS = Total Revenue from Ads / Total Ad Spend
Let’s make this real. Say you run a Shopify store that sells high-quality leather bags. You decide to launch a campaign on Meta to show off a new product line.
You spend $1,000 on the campaign over one week.
In that same week, you can directly attribute $5,000 in sales to those ads.
Plugging this into the formula: $5,000 (Revenue) / $1,000 (Ad Spend) = 5
This result is usually shown as a ratio, so you have a 5:1 ROAS. It means for every single dollar you put into that campaign, you got five dollars back. Right away, that simple number tells you the campaign was a financial win.
What’s a Good ROAS, Anyway?
While a 5:1 ROAS sounds fantastic, you need some context. What's considered "good" can vary wildly depending on your industry, profit margins, and business goals.
ROAS Benchmarks at a Glance
This table gives you a quick snapshot of what to aim for across different channels.
Platform / Goal | Average ROAS | Good ROAS | Excellent ROAS |
|---|---|---|---|
Ecommerce | 2.87:1 | 4:1 | 5:1+ |
Google Search | 2:1 | 4:1 | 6:1+ |
Facebook Ads | 3:1 | 5:1 | 8:1+ |
Instagram Ads | 2.5:1 | 4:1 | 7:1+ |
These numbers are just a starting point, of course. As you can see, an "average" ROAS across most industries hovers around 2.87:1, which means businesses typically see $2.87 back for every $1 spent. For online retail, a solid benchmark to aim for is 4:1, with the top-tier brands often pushing past 5:1. You can dig deeper into these numbers with this great breakdown of eCommerce benchmarks on OpenSend.
Ultimately, ROAS is your north star. A high ROAS tells you that your targeting, creative, and offer are hitting the mark with your audience. A low ROAS, on the other hand, is your early warning system—a red flag telling you something's wrong and needs fixing before you burn through more of your budget. Without it, you’re just guessing.
Calculating ROAS The Right Way
Knowing the formula for ROAS is easy. Applying it correctly? That's where the real magic happens. Getting an accurate calculation means knowing exactly where to pull your numbers from and, more importantly, how to read the story that final number tells about your business.
Let’s walk through this with a fictional e-commerce brand, "Glow Skincare." Say they spent $2,000 on a Meta campaign and another $1,500 on Google Ads this month. The trick is to find the revenue directly tied to those specific campaigns.
Finding Your Revenue and Ad Spend
To get the whole story, you need to pull data from two places: your ad platforms and your e-commerce backend (like Shopify).
Ad Spend: This one's straightforward. You'll find it right inside your Meta Ads Manager and Google Ads dashboard. For Glow Skincare, the total ad spend is $3,500.
Attributed Revenue: This is the sales figure your ad platforms report. Let's say Meta claims $10,000 in sales and Google reports $8,000. That gives us a total attributed revenue of $18,000. Solid tracking is absolutely crucial here. If your data feels a bit fuzzy, our guide on using UTMs for Google Analytics can help you make sure every dollar is tracked back to its source.
With these numbers in hand, Glow Skincare's overall ROAS is:
$18,000 (Revenue) / $3,500 (Ad Spend) = 5.14
We'd usually write this as a 5.14:1 ROAS. For every dollar they put into ads, they got $5.14 back in revenue. Sounds pretty good, right?
Why a Good ROAS Can Still Be Bad News
A 5.14:1 ROAS looks great on paper, but it doesn't guarantee you're rolling in profit. You have to measure it against your break-even point.
The most critical step in understanding ROAS is calculating your break-even ROAS. This is the point where you are neither making nor losing money on your ad spend after accounting for the cost of your products.
The formula is surprisingly simple: Break-Even ROAS = 1 / Profit Margin.
Let's imagine Glow Skincare has a 40% profit margin after you factor in the cost of goods sold (COGS), packaging, and payment processing fees.
Their break-even ROAS would be:
1 / 0.40 = 2.5
This tells them they need a 2.5:1 ROAS just to cover the cost of their products and the ads themselves. Since their actual ROAS is 5.14:1, they’re well into profitable territory.
But what if their margin was only 20%? Their break-even ROAS would jump to 5:1. In that case, their 5.14:1 campaign ROAS means they're just barely scraping by. This simple bit of context changes ROAS from a vanity metric into a real gauge of financial health.
Understanding ROAS Across Different Marketing Channels
So, what’s a “good” Return on Ad Spend? That’s the million-dollar question, and the honest answer is: it depends. There’s no magic number. A successful ROAS is a moving target that shifts depending on where you’re running ads and what you hope to accomplish. Treating it like a one-size-fits-all metric is a surefire way to misread your data and make some costly mistakes.
Think of it this way: expecting the same ROAS from a Google Shopping campaign and a Meta prospecting campaign is like asking a sprinter and a marathon runner to finish the same race in the same time. They’re built for different things. A customer typing a specific product into Google is already halfway to the checkout line. Their intent is high, so you should absolutely expect a higher, more immediate return from that ad.
On the other hand, a Meta prospecting campaign is all about introducing your brand to people who might not even know you exist. The immediate goal isn't just a sale; it's about getting on their radar. The ROAS here will naturally be lower, but that’s not a failure. It's an investment in filling the top of your marketing funnel for future growth.
Before we dive deeper into those differences, let's nail down the core calculation. It's refreshingly simple.
This formula—revenue divided by ad spend—is the bedrock of understanding how effectively your ad dollars are working for you.
How Profit Margins and Business Goals Change the Game
Your own business model plays a massive part in defining what a "good" ROAS looks like for you. A brand with healthy 80% profit margins can stomach a lower ROAS and still turn a tidy profit. But if you’re working with razor-thin 20% margins, you need a much higher return just to break even.
Your bigger business goals matter, too. Are you a new startup trying to grab market share? In that case, you might be willing to accept a break-even or even slightly negative ROAS just to get new customers in the door, banking on their long-term value.
A lower ROAS on a top-of-funnel awareness campaign isn't a failure—it's a strategic investment. It's the cost of introducing your brand to a future loyal customer. Chasing a high ROAS everywhere can starve the very channels that fuel long-term growth.
Comparing ROAS Benchmarks by Channel and Campaign Type
To set realistic expectations, you have to look at each channel and campaign on its own terms. User intent and behavior vary wildly from platform to platform, and so do the returns. The table below breaks down what you might expect from different channels and campaign types.
Channel / Campaign Type | Typical ROAS Range | Primary Goal | Key Consideration |
|---|---|---|---|
Google Search (Branded) | 8X - 20X+ | Capture existing demand | Users are already looking for you; high intent. |
Google Shopping | 4X - 8X | Drive product sales | High commercial intent, but competitive. |
Meta (Retargeting) | 5X - 10X | Re-engage warm audience | Targeting users who already know your brand. |
Meta (Prospecting) | 1.5X - 3X | Brand awareness, new users | Top-of-funnel; an investment in future sales. |
TikTok / Reels (Awareness) | 1X - 2.5X | Reach and engagement | Focus is on visibility, not immediate conversion. |
As you can see, a high-intent Google Search campaign should be held to a much higher standard than a TikTok awareness video. General benchmarks often point to an average 4X ROAS (or 400%) as a solid target for platforms like Meta and Google Shopping, but as we've discussed, context is everything.
Understanding these nuances is the key to moving beyond chasing a generic number. It allows you to build a smart, layered marketing strategy where every pound or dollar is spent with a clear purpose. For a deeper dive into platform-specific tactics, check out our guide to improve Google Ads performance.
Thinking Beyond ROAS with CPA and LTV
While a killer ROAS might feel like the ultimate victory, it's really just one piece of the puzzle. It tells you if a specific transaction was profitable, but it doesn't tell you anything about the future of that customer relationship.
To build a business that lasts, you need to zoom out. That's where two other critical metrics come into play: Cost Per Acquisition (CPA) and Customer Lifetime Value (LTV).
Think about it like a coffee shop. ROAS tells you that you made a profit on the single latte you just sold. LTV tells you that the same customer is going to come back every morning for the next five years. All of a sudden, that initial profit seems a lot less important than the long-term relationship you just started.
Understanding the Trade-Off Between ROAS and LTV
Cost Per Acquisition (CPA) is simply what you pay to get a new customer in the door. Customer Lifetime Value (LTV), on the other hand, is a forecast of the total revenue that customer will bring you over their entire relationship with your brand.
When you look at these two alongside ROAS, you get a much clearer, more complete picture of your marketing's health.
Sometimes, it's actually a brilliant move to accept a lower ROAS on a customer's first purchase if you know they have a high LTV. A subscription box company, for example, would gladly break even on the first month's box if they know the average subscriber sticks around for 12 months.
Focusing only on maximizing immediate ROAS can be a trap. It might cause you to shut off valuable top-of-funnel campaigns that bring in high-LTV customers, just because their initial return isn't as high as a simple retargeting ad.
This shift in perspective is what separates good marketers from great ones. It helps you balance short-term wins with long-term, sustainable growth by focusing on acquiring the right customers, not just the cheapest ones.
Putting It All Together in a Real-World Scenario
Let's say you're running two different ad campaigns for your skincare brand:
Campaign A (High ROAS): This is a retargeting campaign pushing a single, popular face cream. It's crushing it with an 8:1 ROAS. The catch? Most buyers are one-and-done purchasers who just wanted that one product. Their average LTV is only $50.
Campaign B (Lower ROAS): This campaign targets a brand-new audience with an introductory skincare kit. The initial ROAS is just 3:1, barely profitable. But here's the magic: 40% of these new customers sign up for a subscription, resulting in an average LTV of $300.
If you were obsessed with ROAS alone, you'd pour every last dollar into Campaign A. But when you factor in LTV, Campaign B is the clear winner for the long haul. It's building a predictable, high-value revenue stream for your business.
This is the strategic framework that top-tier performance marketers use to scale brands. By truly understanding what ROAS is in digital marketing and how it interacts with CPA and LTV, you can start making smarter, more forward-thinking decisions.
Proven Strategies to Improve Your ROAS
Knowing your ROAS is just step one. The real challenge—and where the money is made—is improving it. A low ROAS isn't a failure; it’s a flashing sign telling you it's time to fine-tune your strategy. With the right adjustments, you can turn those cash-burning campaigns into reliable profit engines.
The idea is to systematically work on every piece of the puzzle: who you’re targeting, what creative you’re showing them, and where you’re sending them after they click. Small, smart tweaks in these areas often lead to surprisingly big jumps in your return.
Sharpen Your Audience Targeting
There’s no faster way to waste money than showing your ads to people who will never buy. That's why precision targeting isn't just a tactic; it's the bedrock of a healthy ROAS. Instead of casting a wide, expensive net, you need to zero in on the users most likely to become customers.
This means digging deeper than basic demographics and getting really specific with your audience segments.
Build Custom and Lookalike Audiences: Take your list of best customers and upload it to platforms like Meta. They'll find new users who share similar behaviors and interests, essentially cloning your ideal buyer.
Leverage Retargeting: Someone who visited your website but left without buying is a warm lead. Don't let them get away! Set up specific campaigns to bring them back, reminding them of what they were looking at.
Utilize Negative Keywords: For search ads, this is a must. Actively add keywords you don't want to show up for. This single move immediately stops you from paying for irrelevant clicks that have no chance of converting.
Develop Compelling Ad Creative
Even if you nail the targeting, a bland or confusing ad will fall flat. Your creative—the images, videos, and words you use—is what has to stop someone mid-scroll and convince them to pay attention.
A high click-through rate (CTR) is often a great sign that your ROAS is headed in the right direction. When more of the right people click, your cost per click usually drops, which directly boosts your efficiency. If your creative is getting ignored, it’s time to head back to the drawing board.
Key Insight: Your ad creative should speak directly to a specific audience's pain point and present your product as the clear solution. Vague messaging rarely inspires action.
Improving your ads is a continuous cycle of testing and learning. For a deeper dive, our guide on how to improve click-through rate is packed with actionable tips for your creative and copy.
Optimize Your Landing Pages for Conversion
Your ad makes a promise; your landing page has to deliver on it. The journey from the ad to your site needs to feel absolutely seamless. If your landing page is slow, confusing, or doesn't match the ad's message, you'll see people bounce immediately, taking your ROAS down with them.
Focus on making the experience as smooth as possible.
Ensure Message Match: The headline, images, and offer on your landing page must directly reflect the ad that brought them there. Any disconnect creates confusion and kills conversions.
Improve Page Speed: We're all impatient online. A page that takes more than a couple of seconds to load will lose a huge chunk of potential customers before they even see your offer.
Simplify the Checkout Process: Get rid of any unnecessary steps or form fields. A long, complicated checkout is one of the biggest reasons people abandon their carts.
By methodically refining these three core areas—targeting, creative, and conversion—you create a powerful system for boosting your ROAS and getting more profitable growth from every dollar you spend.
Translating ROAS Data into Action with SpendOwlAI

Understanding your ROAS is a great first step, but it’s only half the job. The real challenge comes next: turning that number into smart, decisive action. This is exactly where most of us get stuck, staring at dashboards full of bouncing data and asking, "Okay, so what do I do right now?"
This gap between insight and execution is precisely what SpendOwlAI was built to fix. Instead of just presenting you with more charts, the platform actually analyzes the data for you and serves up a clear, prioritized list of daily actions. It cuts through the noise of performance dips, creative fatigue, and audience saturation to tell you exactly where your attention is needed most.
From Raw Data to Confident Decisions
Let's get practical. Imagine your ROAS on a key campaign starts to drop. Is it the ad creative going stale? Has your target audience seen it too many times? Trying to diagnose the root cause manually is a time-suck, and frankly, it often comes down to a gut feeling.
SpendOwlAI automates this entire diagnostic process, connecting the dots between your ROAS and all the other metrics that influence it. It turns those complex signals into simple, clear directives.
Budget Shift Recommendations: It might suggest pulling budget from a campaign with a falling ROAS and redirecting it to another one that's picking up steam, saving you from throwing good money after bad.
Creative Fatigue Alerts: The system can flag specific ads that are losing their punch, giving you a heads-up to refresh them before they drag down the whole campaign.
Audience Saturation Insights: You'll get notified when a specific audience is getting tired of your ads, helping you prevent negative returns and find fresh segments to target.
By turning raw performance data into a simple to-do list, SpendOwlAI takes the guesswork out of the equation. It helps you act with confidence, making small, daily adjustments that directly protect and improve your ROAS. This shifts the conversation from "what is ROAS?" to "what can I do to improve it today?"
ROAS FAQs: Your Questions Answered
Even when you know the formula, putting ROAS into practice can bring up some tricky questions. Let's tackle some of the most common ones that pop up for operators in the trenches.
How Often Should I Check My ROAS?
When you have live campaigns running, it's tempting to hit refresh every hour. A daily check-in is smart for catching big swings or trends.
But a word of caution: don't overreact to a single bad day. Performance naturally fluctuates. To get a more reliable picture, look at a 3-day or 7-day rolling average. This smooths out the daily noise and gives you a much better foundation for making smart decisions.
Can I Have a Good ROAS but Still Lose Money?
Yes, and this is a trap that snares a lot of marketers. It’s one of the most important things to understand about this metric.
ROAS only looks at the revenue generated from your ad spend, not your total profit. Imagine your business runs on a 30% profit margin. To even break even, your ROAS needs to be higher than 3.34:1. Anything less, and you're actually losing money on every sale, even if the ROAS looks good on paper.
A high ROAS doesn't automatically equal profit. Always measure it against your break-even ROAS (calculated as 1 / profit margin) to know if your campaigns are actually making money.
Is ROAS the Same as ROI?
They're related, but definitely not the same. Think of it like this: ROAS is a specialist, while ROI is the general manager.
ROAS is laser-focused on ad campaign efficiency. It asks, "For every dollar we put into ads, how many dollars in revenue did we get back?" The formula is simple: Revenue / Ad Spend.
ROI (Return on Investment) is the big-picture metric. It looks at the overall profitability of an initiative by factoring in all your costs—ad spend, the cost of the goods you sold, salaries, software, you name it.
ROAS tells you if your ads are working. ROI tells you if your business is profitable.
Stop guessing what your ROAS data is trying to tell you. SpendOwlAI analyzes your performance signals and delivers a clear, prioritized list of daily actions to protect and improve your returns. Start your free 7-day trial and execute with confidence.