Mastering the Key Metric Definition for Business Growth
A key metric is a single, measurable value that shows how effectively your business is hitting its most important goals. It’s less of a map and more of a compass; it doesn't show you every twist and turn in the terrain, but it always points you toward your destination, guiding your most critical decisions.
What A Key Metric Definition Really Means
Let's cut through the noise. In a world drowning in data, a true key metric is all about focus. It’s that one specific, quantifiable measure that directly links your day-to-day actions to your biggest business goals.

Imagine you're piloting an airplane. The cockpit is covered in dozens of dials and gauges. While they all give you some information, you’re really relying on just a handful—altitude, speed, and fuel—to get where you're going safely.
Those are your key metrics. Everything else is just supporting data, but not the numbers you’d bet the entire flight on.
Separating Signal From Noise
The biggest challenge today isn't a lack of data; it's telling the difference between what feels good and what actually grows the business. This is the classic battle between "vanity metrics" and actionable "key business metrics."
Vanity Metrics: These numbers look impressive on the surface but don't actually translate to business outcomes. Think social media likes, page views, or total app downloads. They can be easily manipulated and rarely inform smart strategic moves.
Key Business Metrics: These are the numbers that tell you if you're winning or losing. They tie directly to revenue, profitability, and customer satisfaction. Think customer acquisition cost (CAC), conversion rate, and return on ad spend (ROAS).
To make this crystal clear, here’s a quick comparison of the two.
Vanity Metrics vs Key Business Metrics
A clear comparison to help you distinguish between metrics that look impressive and metrics that build your business.
Metric Type | Example | Why It's Deceiving or Valuable |
|---|---|---|
Vanity Metric | Social Media Likes | Looks great in a report, but doesn't correlate to sales or customer loyalty. High engagement, zero impact. |
Key Business Metric | Customer Acquisition Cost (CAC) | Tells you the real cost to get a paying customer. Directly impacts your profitability and budget. |
Vanity Metric | Website Page Views | Shows traffic, but not intent. 100,000 visitors who leave immediately are less valuable than 1,000 who buy. |
Key Business Metric | Conversion Rate | Measures how many of those visitors actually took a meaningful action (like making a purchase). |
Vanity Metric | Number of Email Subscribers | A large list is useless if no one opens your emails or buys from you. It’s just a number. |
Key Business Metric | Customer Lifetime Value (LTV) | Predicts the total revenue a single customer will generate. Informs marketing spend and retention efforts. |
It's easy to get distracted by numbers that make you look good. But focusing on key business metrics is what keeps you in business.
A high number of website visitors is a vanity metric. A high conversion rate from those visitors is a key business metric. The first tells you people showed up; the second tells you they bought something.
Getting this right is the first step toward making smarter decisions. For example, focusing only on driving traffic (a vanity metric) could trick you into spending thousands on ads that attract people who never buy. Instead, optimizing for a lower CAC (a key metric) ensures every dollar you spend is efficiently bringing in paying customers. You can see exactly how this works by understanding how to define marketing ROI and its direct connection to your company's health.
Ultimately, a well-chosen key metric provides one thing above all else: clarity. It tells you and your team exactly what to focus on to make the biggest impact, turning abstract goals into a concrete, measurable mission.
The Most Important Metrics for Performance Marketing
Alright, now that we’ve pinned down what a key metric is in theory, let's get into the nitty-gritty. In the world of performance marketing, a handful of metrics really run the show. They’re not just numbers on a dashboard; they're the vital signs of your campaigns, telling you everything you need to know about profitability, efficiency, and overall marketing health.
If you're managing an ad budget, getting comfortable with these metrics is non-negotiable. They cut through the noise and give you a clear, actionable story about what’s working, what isn't, and where you should be putting your money.
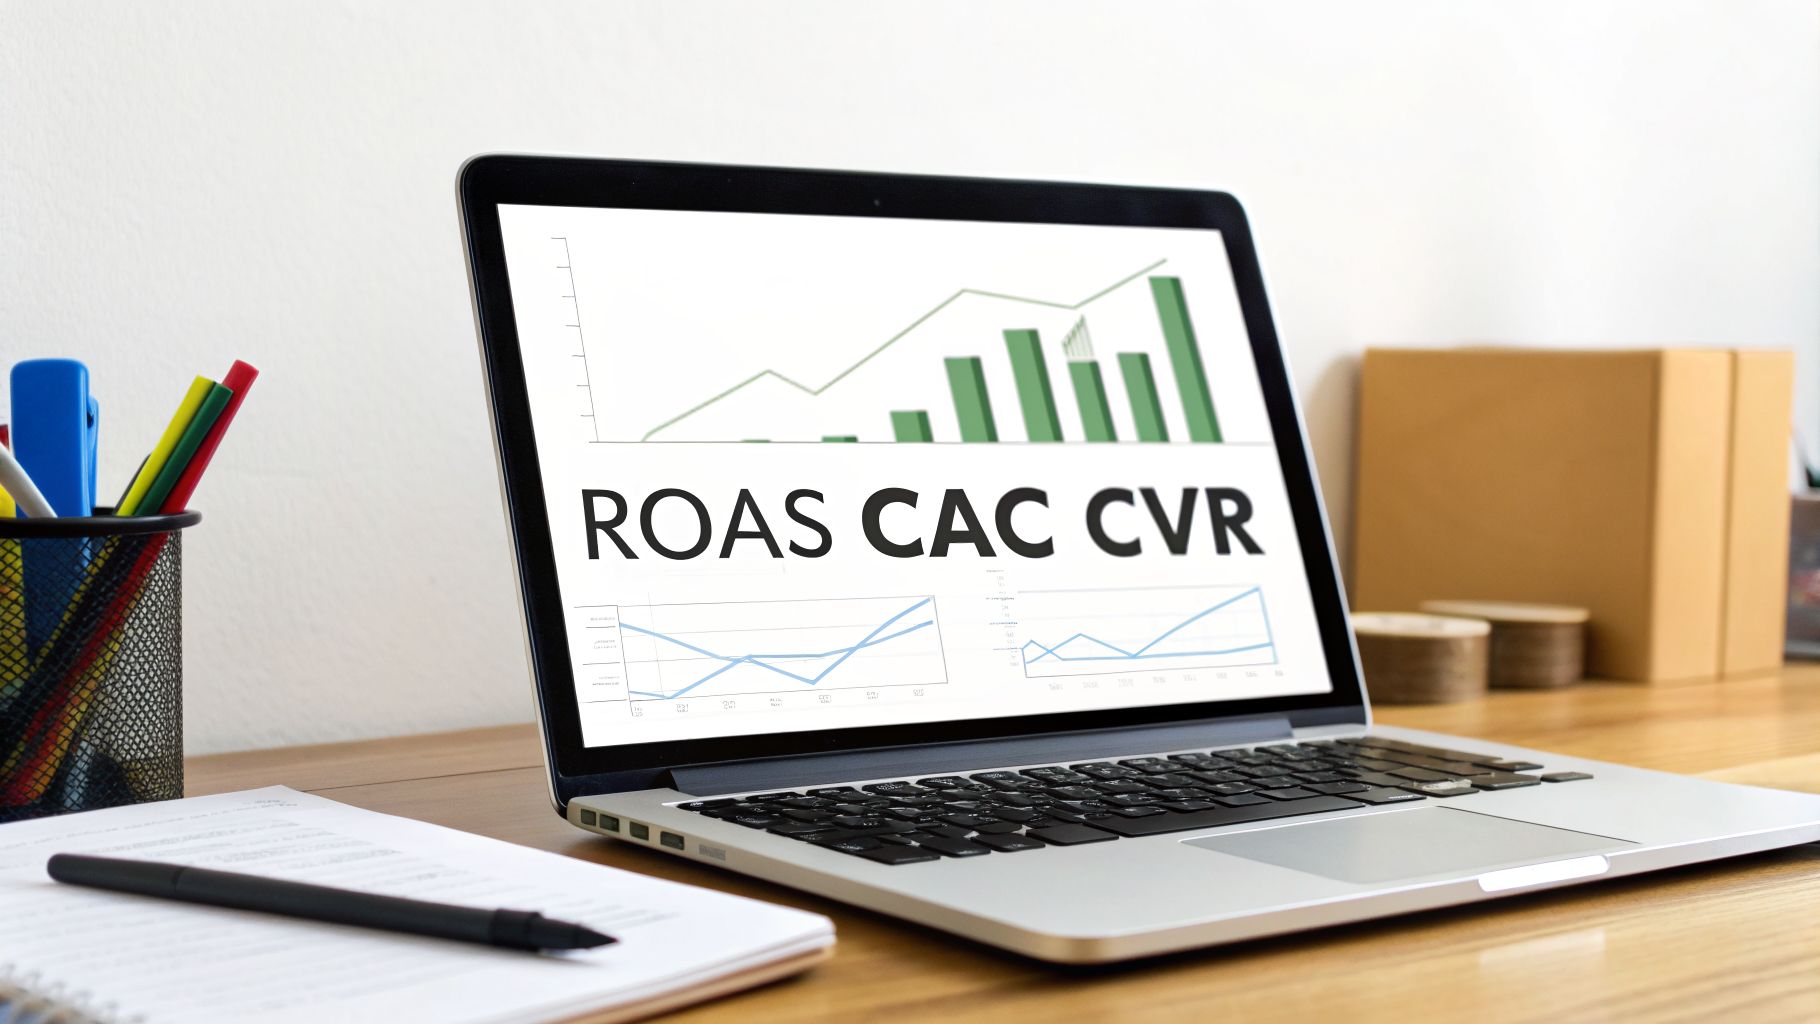
The Profitability North Star: ROAS
Return on Ad Spend (ROAS) is almost always the first place marketers look, and for good reason. It answers the most fundamental question we all have: for every dollar I spend on ads, how much am I getting back?
It's a simple ratio. A ROAS of 4:1, for example, means you're bringing in $4 in revenue for every $1 spent. This direct line to revenue makes it the ultimate measure of an ad campaign's profitability. A healthy ROAS is the first, most crucial sign that your marketing is actually making money. For a much deeper dive, check out our guide on what ROAS is in digital marketing.
But here’s the thing: ROAS has grown up. It's no longer just a vanity metric to chase. Smart marketers now see it as one piece of a much larger puzzle. You have to look at it alongside other metrics to get the full performance picture.
The Efficiency Checkpoint: CAC
Next up is Customer Acquisition Cost (CAC). This tells you exactly what it costs, on average, to bring a new customer through the door. You calculate it by dividing your total marketing spend by the number of new customers you gained in that same period.
Let's say you spent $1,000 on a campaign and brought in 50 new customers. Your CAC is a clean $20. This number is absolutely critical for figuring out if your business model is sustainable. If your CAC is higher than what a customer typically spends with you, you're quite literally paying to lose customers.
Key Takeaway: ROAS tells you how much revenue your ads are generating. CAC tells you how much it costs to get each customer. One measures income, the other measures the expense.
The Action Indicator: Conversion Rate
Finally, there’s Conversion Rate (CVR). This metric tracks the percentage of people who take the specific action you want them to. That "action" could be anything—making a purchase, signing up for a newsletter, downloading a guide, you name it.
A high CVR is a great sign. It means your ad copy, your landing page, and your offer are all hitting the mark with your audience. It’s the metric that confirms your entire funnel, from the initial ad click to the final thank you page, is actually working.
These three metrics are a team; they tell a story together. A fantastic click-through rate means nothing if your conversion rate is abysmal. That scenario will just lead to a sky-high CAC and a terrible ROAS. By looking at these signals in concert, you get a 360-degree view of your marketing health and can start making the smart decisions that lead to real, sustainable growth.
Unlocking Profitability with SKU-Level Metrics
Great marketers know the truth: campaign averages lie. The most successful e-commerce brands have figured out that real profitability isn't found in a high-level ROAS number—it's buried in the details of SKU-level metrics.
Think about it. Your ad account reports a solid 4:1 ROAS. Looks great, right? But that blended average can be a Trojan horse. It might be propped up by one superstar product, while a dozen others are quietly burning through your cash.
Looking Beyond Campaign Averages
Let's get specific. Imagine a fashion brand running a single campaign for both jackets and t-shirts.
The Hero Product: Their $300 high-margin jackets are crushing it, bringing in an 8:1 ROAS and making the whole campaign look like a winner.
The Hidden Drain: Meanwhile, their $25 low-margin t-shirts are barely hitting a 1.5:1 ROAS, bleeding money on every single conversion.
Without SKU-level data, the brand sees the 4:1 average and keeps pouring money into the campaign, completely unaware that the t-shirts are a financial black hole. Knowing your break-even point is everything here. We have a whole guide on how to use a break-even ROAS calculator that can help you find these hidden drains.
By isolating performance at the individual product level, you stop celebrating misleading averages and start making decisions that directly impact your bottom line.
How Granular Data Transforms Decisions
This is where the magic happens. Once you can see precisely which products are making you money and which are costing you, you gain a massive strategic advantage.
This kind of clarity changes everything. You can confidently shift your ad budget to your most profitable SKUs and build ad creative that features those specific winners. It even guides your inventory planning, helping you avoid overstocking the duds while ensuring your top sellers are always ready to ship.
Moving from campaign averages to SKU-level analysis is the leap from just "running ads" to building a truly efficient growth engine.
How to Choose Your Key Metrics for Each Business Goal
Picking the right key metric is like using the right tool for the job. You wouldn't use a hammer to turn a screw, no matter how hard you swing it. Your most important metrics should always tie directly back to what you're trying to achieve. Your mission dictates your measurement.
A classic mistake is judging a campaign by the wrong standard—like getting frustrated over a lack of sales from an ad designed purely to build brand awareness. This kind of mismatch just leads to confusion and bad decisions. The trick is to match your metric to your goal and its specific place in the marketing funnel.
Aligning Metrics with Funnel Stages
Are you just trying to introduce your brand to a new crowd? Then your focus should be on top-of-funnel metrics that track reach and attention.
Goal: Brand Awareness - Here, the whole point is getting your brand in front of as many relevant eyeballs as possible. Your key metric isn’t sales; it's visibility.
Primary Key Metric: Impressions or Reach
Secondary Key Metric: Video View Rate
Goal: Lead Generation - At this stage, you're trying to capture interest and get a read on potential customers. The focus shifts from just being seen to getting people to take a small action.
Primary Key Metric: Cost Per Lead (CPL)
Secondary Key Metric: Conversion Rate (for email sign-ups or downloads)
Goal: Driving Sales - Now we're at the bottom of the funnel, where every dollar counts. Every metric here needs to connect directly to revenue and efficiency.
Primary Key Metric: Return on Ad Spend (ROAS)
Secondary Key Metric: Customer Acquisition Cost (CAC)
To make this crystal clear, here’s a simple framework you can use to select the most impactful metrics for any marketing objective you have.
Matching Key Metrics to Your Business Goals
Business Goal / Funnel Stage | Primary Key Metric | Secondary Key Metric |
|---|---|---|
Awareness (Top of Funnel) | Impressions / Reach | Video Views, Ad Recall Lift |
Consideration (Middle of Funnel) | Click-Through Rate (CTR) | Cost Per Click (CPC), Landing Page Views |
Conversion (Bottom of Funnel) | ROAS / CPA | Conversion Rate, Average Order Value (AOV) |
Loyalty & Retention | Customer Lifetime Value (LTV) | Repeat Purchase Rate, Churn Rate |
Think of this table as your starting point. The primary metric is your North Star for that goal, while the secondary metric gives you important context and helps diagnose why the primary metric is moving.
Evolving Your Metrics as Your Business Grows
The metrics you obsess over today shouldn't be the same ones you obsess over a year from now. They need to evolve right alongside your business.
A scrappy startup might be laser-focused on acquiring new customers at almost any reasonable cost, making Customer Acquisition Cost (CAC) their one true guide.
But as a company matures, the game changes. The focus naturally shifts from pure acquisition to building a truly profitable and sustainable business. This is where a metric like Customer Lifetime Value (LTV) becomes absolutely essential, as it tells you the total value a customer brings over their entire relationship with your brand.
For e-commerce teams with tight budgets, CAC is the gatekeeper of efficiency—every dollar has a direct impact on cash flow. The relationship between CAC and LTV is really the bedrock of sustainable growth. To dig deeper into this crucial dynamic, you can explore more insights about marketing metrics and performance.
The diagram below shows how you can peel back the layers of profitability, going from a high-level campaign view all the way down to individual products. This is where you find out what's really making you money.
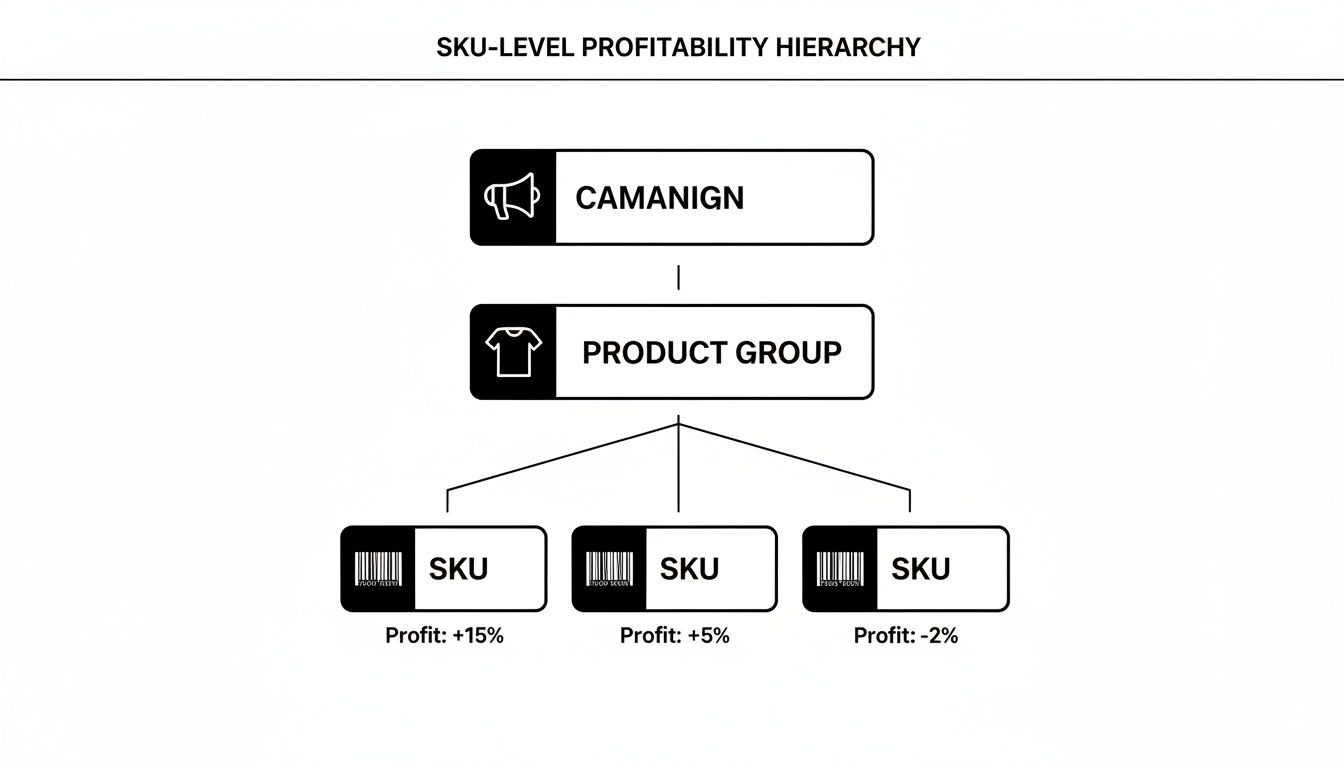
As you can see, a campaign that looks profitable on the surface can easily hide unprofitable SKUs that are draining your resources. This is exactly why getting more granular with your analysis becomes so critical as you scale. By constantly re-aligning your key metrics with your current business goals, you ensure you’re always measuring what matters most and guiding your team toward the most impactful actions.
Common Mistakes That Can Derail Your Metric Tracking
Data can tell you a story, but it's easy to misread the plot. Even experienced marketers can fall into a few common traps that turn good data into bad decisions. Just tracking numbers isn't the goal—you have to learn how to interpret them correctly to get a real advantage.
One of the biggest mistakes I see is context blindness. This is when you fixate on a single metric without looking at the bigger picture. A classic example? Freaking out because ROAS dropped for one day on a brand-new campaign. That metric doesn't live in a vacuum. It’s constantly being nudged by things like ad fatigue, auction dynamics, or even just the fact that it's a Tuesday.
On the flip side, you have analysis paralysis. With so much data at our fingertips, it’s incredibly easy to get so overwhelmed that you can't make a confident decision about anything. The whole point is to zero in on the handful of metrics that truly drive your business forward, not get lost in the noise.
Setting Up Guardrails to Keep Your Analysis on Track
To steer clear of these traps, you need a disciplined approach. Think of it as setting up guardrails for your decisions. Before you ever hit pause on a campaign or start pouring more money into an ad set, you need to know what a real signal looks like versus temporary static.
Give It Time: Never, ever make a big call based on just 24 hours of data. You need to look for trends over at least 3-7 days to see if a performance shift is actually happening or if it's just a one-day blip.
Know Your Numbers: Define your break-even points before you launch. What’s the absolute lowest ROAS you can live with? What's the highest CPA your business can handle? Having these thresholds set in stone stops you from making emotional, knee-jerk reactions later.
Connect the Dots: If your conversion rate suddenly tanks, don't just stare at that one number. Immediately check your click-through rate and your landing page traffic. A dip in one area almost always explains what's happening in another, giving you the full story.
The most dangerous metric is the one you look at by itself. A high click-through rate means nothing if your conversion rate is zero, and a great ROAS on Monday doesn’t erase a disastrous weekend.
Ultimately, smart metric tracking is as much about what you choose to ignore as what you watch. It's no surprise that conversion rate has become such a critical metric—it's the one that most directly ties marketing spend to actual growth. In fact, optimizing for conversions is now the second-most-used tactic by marketers, with 50% of professionals focusing on it. This really shows that the industry gets it: traffic is nice, but quality conversions are what separate the winners from everyone else. You can find more great insights about key marketing metrics over at targetmarket.com.
By avoiding these common slip-ups and always demanding context, you’ll save time, money, and a whole lot of stress. You'll be making moves based on real signals, not just distracting noise.
Turning Your Key Metrics into Action
Knowing your key metrics is one thing. Actually doing something with them is another game entirely. The final—and most important—step is creating a system that connects the dots between raw data and confident, daily decisions. This is how you turn passive reporting into an active, strategic edge for your business.
The real objective is to get past the habit of just watching your ROAS and CPA numbers bounce around. A truly effective setup constantly scans for meaningful shifts in your metrics, cutting through the daily noise to flag what actually demands your attention and action.
From Data Points to Action Plans
Stop drowning in dashboards. Imagine getting a prioritized list of recommended actions based on what the data is telling you right now. This approach flips metric tracking on its head, turning it from a backward-looking chore into a forward-looking operational advantage.
For instance, a smart system could alert you to things like:
Creative Fatigue: It might highlight an ad with a sharp drop in CTR, suggesting you swap it out before it burns more of your budget.
Audience Saturation: You could get a heads-up that your CPA is steadily creeping up for a specific audience, signaling it's time to broaden your targeting.
SKU-Level Opportunities: The system could spot a single product whose individual ROAS is taking off, recommending you push more budget its way to ride the wave.
The ultimate goal is to spend less time digging for problems and more time acting on opportunities. An intelligent system surfaces the "what" and the "why," so you can focus on the "how."
Making this leap requires a new way of thinking—and the right tools. With a platform like SpendOwlAI, this whole process is automated. It doesn't just feed you numbers; it translates those numbers into clear, explainable actions sorted by potential impact. This is how you stop reacting to data and start executing with precision, knowing every move is backed by a solid understanding of what your metrics are telling you.
Key Metrics FAQs: Your Questions, Answered
Let's dig into some of the most common questions we hear from marketers. These are the practical, real-world issues that come up when you start putting key metrics to work.
How Often Should I Be Checking My Metrics?
It’s tempting to hit refresh on your ad dashboard every five minutes, but that's a recipe for whiplash. For active paid campaigns, a daily check-in on metrics like ROAS and CPA is a good habit. You want to catch any major fires before they burn down the house.
But—and this is a big but—don't make knee-jerk decisions based on a single bad day. Look for trends over a 3-7 day window. That’s where the real insights are hiding.
On the flip side, bigger-picture metrics like Customer Lifetime Value (CLV) are best reviewed monthly or quarterly. The trick is to separate the daily tactical monitoring from the strategic, trend-based decisions that actually move the needle.
What’s a “Good” Benchmark for Something Like ROAS?
This is the million-dollar question, and the answer is usually a frustrating "it depends." Industry benchmarks can be a dangerous distraction.
A "good" ROAS is completely unique to your business. It's a function of your product margins, your industry, and what you’re trying to achieve right now. A brand selling luxury watches with a 70% margin might be ecstatic with a 3:1 ROAS, while a dropshipper with slim margins might need an 8:1 just to break even.
Instead of chasing what someone else is doing, focus on beating your own numbers. Your most important benchmark is your break-even point. Are you profitable? That's what matters—not some arbitrary number you found in a blog post.
This internal focus keeps you tethered to the financial reality of your own business.
Should My Key Metrics Evolve as My Business Grows?
Absolutely, and they must. Your key metrics should always mirror your current business priorities.
An early-stage startup might be laser-focused on Cost Per Acquisition (CPA) because their main goal is just to get customers in the door and grow as fast as possible. But once that business matures, the goalposts move. The focus naturally shifts from pure growth to sustainable profitability and retention.
That’s when metrics like Customer Lifetime Value (CLV) and repeat purchase rate take center stage. They become the new guiding lights. Your metrics aren't set in stone; they're a living part of your strategy that should adapt as your company hits new stages of growth.
Stop chasing noisy data and start taking decisive action. SpendOwlAI turns complex ad performance into a clear, ranked list of what to do next, saving you time and eliminating wasted spend. Get your free 7-day trial and execute with confidence.