Ecommerce Performance Metrics That Actually Drive Growth
When we talk about e-commerce performance metrics, we're really talking about the vital signs of your online store. These are the specific data points that tell you how healthy, efficient, and profitable your business is. They cover everything from how well your ad campaigns are doing—think Return On Ad Spend (ROAS)—to the long-term sustainability of your entire operation, like the Customer Lifetime Value (LTV) to Customer Acquisition Cost (CAC) ratio.
Moving Beyond Vanity Metrics to Actionable Insights
The e-commerce world is swimming in data. But here’s the problem: not all data is created equal. So many store owners get bogged down by numbers, yet they're starved for real wisdom. The biggest hurdle is learning to tell the difference between the metrics that just make you feel good and the ones that actually grow your business.
It’s like the difference between hearing a huge round of applause and actually selling tickets. A million Instagram likes (the applause) feels great, but if it doesn't translate into actual sales (the tickets), it's just noise. Real growth comes from zeroing in on the numbers that have a direct, undeniable link to your bottom line.
Understanding the Metrics Hierarchy
A simple way to cut through the noise is to think of your metrics as a pyramid. At the very top, the peak, is your ultimate goal: profit. But you don't just magically arrive at profit. It's built on a foundation of other interconnected numbers. The most important ones, the actionable metrics, sit right in the middle, directly influencing your profitability. At the wide base of the pyramid are the vanity metrics.
This pyramid visualizes how everything is connected—from the initial "awareness" metrics at the bottom all the way up to profit.
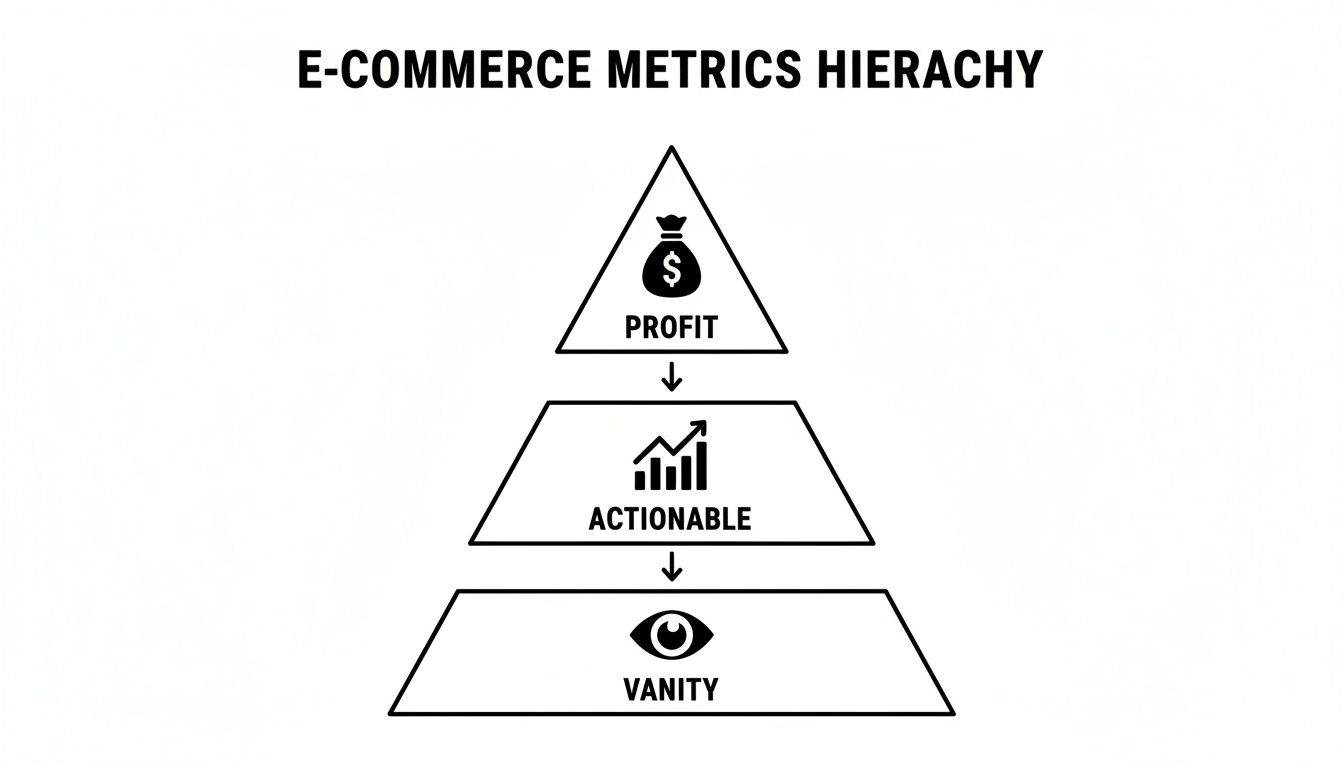
As you can see, profit isn't an island. It’s the direct outcome of strong, actionable metrics that are, in turn, fed by your initial traffic and brand awareness.
To help clarify the distinction, here's a quick breakdown of how these two types of metrics stack up.
Vanity Metrics vs Actionable Metrics
Metric Type | Examples | What It Tells You (And What It Doesn't) |
|---|---|---|
Vanity Metrics | Page Views, Social Media Followers, Email Open Rate, Ad Impressions | What It Tells You: People are seeing your brand. It indicates reach and top-of-funnel awareness. What It Doesn't: If that awareness is turning into revenue, or why people aren't taking the next step. |
Actionable Metrics | Conversion Rate, Average Order Value (AOV), Customer Acquisition Cost (CAC), Return on Ad Spend (ROAS) | What It Tells You: The direct impact of your efforts on sales and profitability. It gives you clear levers to pull. What It Doesn't: Everything. But it tells you where to dig deeper. |
Focusing on actionable metrics allows you to stop guessing and start making informed decisions that actually move the needle.
The real goal for any e-commerce operator is to graduate from just tracking numbers to actively interpreting them. Every metric tells a story. For instance, a dropping Click-Through Rate (CTR) isn't just an "ad problem"—it might be an early warning that your creative is getting stale or that you're no longer connecting with your target audience.
An actionable metric is a number that ties specific, repeatable actions to observed outcomes. The key is that you know what to do if the number goes in the wrong direction.
This shift in mindset is what separates struggling stores from a scaled-up, sustainable brand. Instead of panicking over every little dip, you start to understand the why behind the numbers and can make confident decisions.
Modern tools like SpendOwlAI are designed to help with exactly this. They can cut through the data chaos and give you a clear, prioritized list of what to focus on each day. This turns a mountain of complex data into a simple playbook, so you can put your energy where it truly matters.
Decoding Your Frontline Ad Performance Metrics
Think of your ad campaigns as the welcome mat for your digital storefront. Are people noticing it? Are they stopping to wipe their feet? How much are you paying for each person who steps inside? These frontline ad metrics are your first, most immediate signals telling you if your ads are catching eyeballs or just burning cash.
Getting a handle on these initial numbers is the first real step toward building a profitable ad machine. They're the quick pulse check you need before you start digging deeper into your sales funnel to see what’s working and what isn’t.

The Three Pillars of Ad Engagement
At the very top of your funnel, there are three metrics that work together to give you a clear picture of how people are initially responding to your ads. Understanding how they influence each other is key to making quick, smart decisions on the fly.
Cost Per Mille (CPM): Imagine you’re renting a billboard on a busy digital highway. CPM is simply the price you pay for every 1,000 sets of eyes (impressions) that pass by your ad. It's the basic cost of advertising real estate. A high CPM usually means you’re trying to get space in a very competitive, high-traffic area.
Click-Through Rate (CTR): Now, how compelling is your billboard? CTR tells you exactly that. It’s the percentage of people who saw your ad and were interested enough to actually click on it. A high CTR is a great sign that your creative and messaging are really hitting the mark with your audience.
Cost Per Click (CPC): If CPM is the rent for the billboard, CPC is what you pay for every person who decides to take the exit and visit your store. It’s a direct measure of how much it costs to get a potential customer to click through to your website.
These three numbers are always in a delicate dance. A high CPM isn’t automatically a bad thing if your CTR is also sky-high, because that can still lead to a pretty efficient CPC. The real sweet spot, of course, is a high CTR paired with a low CPC. That’s when you know you’ve struck gold with your creative, audience, and offer.
A high CTR is your first sign of a strong product-market-ad fit. It validates that your message is compelling enough to cut through the noise and spark genuine interest from potential customers.
The Hidden Drain on Your Ad Budget
While that core trio tells you about initial interest, a couple of other metrics can warn you when your ads are starting to overstay their welcome. Ignoring them is one of the fastest ways to light your ad budget on fire.
Ad Frequency: This one is simple—it’s the average number of times a single person has seen your ad. If your frequency is 3.5, it means the average person in your audience has seen your ad between three and four times.
Creative Fatigue: This is what happens when your frequency gets too high. People get sick of seeing the same ad over and over, and its performance starts to tank. Your once-killer ad becomes background noise, your CTR drops, and your CPC starts to climb.
This is exactly the kind of trend you can spot in a tool like SpendOwlAI, which visualizes performance so you can catch a downward slide before it turns into a nosedive.
That downward slope is a classic sign of creative fatigue. It’s your cue to swap in some fresh ads.
By keeping a close eye on these frontline ecommerce performance metrics, you can spot this trend early and rotate new creative in before performance completely collapses. This is what separates campaigns that are managed well from those that just leak money. For a look at how these early metrics eventually connect to the bottom line, you might want a deeper dive into what ROAS is in digital marketing.
Measuring Acquisition Efficiency and Profitability
Getting clicks and traffic is just the opening act. The real show begins when you figure out how efficiently you’re turning that attention into actual customers—and, more importantly, if you're making money doing it. Here, we shift from surface-level ad metrics to the core e-commerce numbers that tie your ad spend directly to your bottom line.
Think of customer acquisition as the engine of your store. A sputtering, inefficient engine will just burn through fuel without getting you anywhere. The key is knowing exactly what it costs to get a new customer in the door and how much you’re earning back from that investment.
Distinguishing CPA From CAC
At a glance, Cost Per Acquisition (CPA) and Customer Acquisition Cost (CAC) look like twins. But they measure two very different things, and knowing the difference is vital for getting a true read on your business's health.
Cost Per Acquisition (CPA): This is a tactical, campaign-level metric. It tells you the average cost to get someone to take a specific action, which for e-commerce is almost always a purchase. You calculate it by dividing an ad campaign's total cost by the number of conversions it generated.
Customer Acquisition Cost (CAC): This is a bigger-picture, business-level metric. CAC measures your total, all-in cost to acquire a brand-new customer across all your sales and marketing channels. It includes ad spend, but it also ropes in things like marketing team salaries, software subscriptions, and other overhead.
Basically, CPA tells you if a specific ad is working. CAC tells you if your entire customer acquisition strategy is sustainable. For a deeper dive, check out our complete guide on understanding Cost Per Acquisition.
Let's put this into a real-world Shopify store scenario.
Imagine you spend $1,000 on a Facebook ad campaign this month, and it brings in 50 sales.
Your CPA is: $1,000 / 50 sales = $20 per acquisition. Simple enough.
But to get your CAC, you have to zoom out. Let’s say your total marketing spend for the month was actually $3,000 (that $1,000 on Facebook, plus $500 on Google, and $1,500 in marketing salaries). If all that effort brought you 100 brand-new customers, the math changes.
Your CAC is: $3,000 / 100 new customers = $30 per new customer.
See the difference? CAC gives you a much more honest assessment of what it truly costs to grow your customer base.
Mastering Return On Ad Spend
While CAC tells you the cost side of the story, Return On Ad Spend (ROAS) gives you the revenue side. This is the ultimate gut-check for ad profitability, telling you exactly how many dollars you get back for every single dollar you put into advertising.
The formula couldn't be simpler:
ROAS = Total Revenue from Ads / Total Ad Spend
If you spent $1,000 on ads and they generated $4,000 in revenue, your ROAS is 4x (often written as 4:1). For every dollar you spent, you made four dollars back. Not bad.
You'll often hear that a 4:1 ROAS is the industry benchmark for a "good" return. Take that with a huge grain of salt. A good ROAS is entirely dependent on your profit margins.
High-Margin Businesses: A luxury brand with a 75% profit margin might be incredibly profitable with a 3x ROAS.
Low-Margin Businesses: A store selling low-priced goods with only a 25% margin might need a 6x or 7x ROAS just to break even after factoring in the cost of goods and overhead.
A classic mistake I see growth-focused teams make is chasing the highest ROAS possible, no matter what. Sure, a 10x ROAS looks amazing on a report, but it's often the result of a tiny ad spend targeting a handful of hyper-loyal customers. You can't scale a business on that.
Real growth often means accepting a slightly lower—but still profitable—ROAS in exchange for reaching a much larger volume of new customers. The goal isn't just efficiency; it's profitable scale. It’s all about finding that sweet spot where your ROAS is healthy and your customer base is consistently growing.
From First Click to Customer Lifetime Value
Getting people to your site is just the first lap of the race. The next set of metrics tells you if you can actually cross the finish line and turn those clicks into cash. These are the numbers that connect initial interest to long-term business health, showing you how well your store converts traffic into revenue and one-time buyers into loyal fans.
This is where we put the entire customer journey under the microscope—from the moment someone lands on your page to their final click on the checkout button. Mastering these numbers is what separates the stores that just get traffic from the ones that build empires.
Unpacking Your Conversion Rate
Your Conversion Rate (CR) is the ultimate litmus test for your entire sales funnel. It answers the single most important question: of all the people who visited your store, how many actually bought something? A high conversion rate is a beautiful thing—it means your ads, landing pages, product descriptions, and checkout process are all working in perfect harmony.
But what's a "good" conversion rate? Honestly, it depends. There's no magic number. Recent data shows a huge range across the industry. For example, in 2025, the global average floated between 2% and 4%. But when you look closer, the differences are stark. Personal care products crushed it with a 6.8% CR, while home decor came in at just 1.4%.
Here's another interesting wrinkle: mobile traffic made up 73% of all visits but converted at a lower rate of 2.9% compared to desktop's 4.8%. This is exactly why savvy Shopify teams are obsessed with creating a seamless, thumb-friendly checkout experience.
A low conversion rate is a flashing red light telling you something in the customer journey is broken. It could be anything from a confusing website layout to a surprise shipping fee at the very end. This is where tools that offer marketing attribution software become invaluable, helping you pinpoint exactly where people are bailing.
Boosting Profitability with Average Order Value
While conversion rate is about getting the sale, Average Order Value (AOV) is all about maximizing each sale you get. AOV simply measures the average amount of money a customer spends every single time they place an order.
The math couldn't be easier: AOV = Total Revenue / Total Number of Orders
Increasing your AOV is one of the most powerful moves you can make to grow your profit without needing a single new visitor. Even tiny bumps in this number can have a huge ripple effect on your bottom line. Some tried-and-true tactics include:
Upselling: "Would you like the premium version of that?"
Cross-selling: "Customers who bought this also loved..."
Bundling: Packaging a few products together for a sweet deal.
Free Shipping Thresholds: The classic "Spend $75 and get free shipping!"
When your AOV is climbing, it means every customer you acquire is becoming more valuable, which makes your ad spend work that much harder for you.
The Ultimate Health Score: LTV and the LTV to CAC Ratio
We've finally arrived at the two metrics that define whether your business has a real future: Customer Lifetime Value (LTV) and the all-important LTV to CAC ratio.
Customer Lifetime Value (LTV) is a forecast of the total profit you'll make from a customer over their entire relationship with your brand. It forces you to look beyond the first purchase and see their long-term worth.
When you put LTV side-by-side with your Customer Acquisition Cost (CAC), you get the most fundamental health score for any D2C business. The LTV to CAC ratio tells you if you're building a sustainable company or just burning through cash.
The LTV:CAC ratio is your north star. It answers one simple but critical question: Are you earning more from your customers than you're spending to get them?
A healthy business is built on a strong, positive ratio. Here’s a quick breakdown of what the numbers mean:
1:1 Ratio: You're losing money. Once you factor in the cost of your products, every new customer is a net loss.
3:1 Ratio: This is the gold standard. For every dollar you spend to get a customer, you make three dollars back over their lifetime. This is the sweet spot for sustainable, scalable growth.
5:1+ Ratio: This looks incredible, but it might actually signal you're not investing enough in growth. You could be leaving a lot of money on the table.
Focusing on this ratio forces you to think about the entire business—fine-tuning your marketing to lower CAC while improving your products and customer experience to increase LTV. A business with a healthy LTV:CAC ratio isn't just surviving; it's built to thrive.
An Operator's Playbook for Responding to Metric Shifts
Knowing what all your e-commerce metrics mean is one thing. Knowing what to do when they suddenly go sideways is another beast entirely. Nothing gets the heart racing like a sudden drop in ROAS or a CPC that shoots for the moon. It’s tempting to jump in and start changing everything, but knee-jerk reactions often do more harm than good.
A seasoned operator doesn't just read the numbers; they read the story behind the numbers. This playbook is all about moving from that feeling of reactive panic to a place of strategic, calm response. We're going to stop guessing and start diagnosing, so you can take confident steps backed by actual data.
Differentiating Signal from Noise
The single biggest mistake I see operators make is over-managing their campaigns. They see one bad day and immediately start tweaking budgets, audiences, and creative. Here's the problem: ad platforms like Meta and Google need time to learn.
This is all about Delivery and Learning Stability. Think of the algorithm as a new employee you're training. It needs a steady stream of data over a few days to figure out who your best customers are and how to reach them. If you keep changing its instructions every 12 hours, it never gets out of that initial, inefficient learning phase. You're essentially resetting its progress over and over, trapping your campaigns in a permanent state of underperformance.
Give your campaigns room to breathe. The real skill isn't reacting to every little blip, but spotting a genuine trend that holds for two or three days before you step in.
The goal isn't to react to every single data point. It's to identify a persistent pattern, diagnose the most likely cause, and then act decisively based on evidence, not emotion.
A Diagnostic Chart for Common Scenarios
When a key metric shifts, it's almost never happening in a vacuum. Your metrics are all connected. A change in one is often a symptom of an issue somewhere else in your funnel.
Think of the following table as your quick-reference diagnostic guide. It’s an "If This, Then That" for your ad account, helping you pinpoint where to start digging when performance gets weird. This saves you from wasting time on the small stuff and sends you straight to the real problem.
Ecommerce Metric Diagnostic Chart
Symptom (The Metric Shift) | Potential Cause | What to Investigate First |
|---|---|---|
ROAS is dropping, but CTR is stable. | Your ad is working, but something is broken after the click. | Check your website's Conversion Rate. Is your landing page slow? Did a discount code expire? The problem is likely on your Shopify site, not in the ad account. |
CTR is dropping and CPC is rising. | Your creative has gone stale or your audience has seen it too many times. | Look at Ad Frequency and Creative Fatigue. If your frequency is creeping up past 3 or 4, it's a huge red flag. Your audience is officially tired of seeing that ad. Time for something new. |
CPC is spiking, but CTR is stable. | Competition for your audience is heating up. | Dive into your CPM (Cost Per Mille). A rising CPM means the cost of ad "real estate" is increasing, usually because more brands are targeting the same people you are. It might be time to test new audiences to find cheaper inventory. |
Add-to-Cart rate is high, but Conversion Rate is low. | People want what you're selling, but something is stopping them at the finish line. | Audit your checkout process. Are you surprising them with high shipping costs? Is the flow clunky or asking for too much information? This is the classic sign of friction right before the purchase. |
Following a structured process like this turns a vague "performance is down" feeling into a clear action plan. By systematically investigating the most likely cause, you stop tinkering with things that don't matter and get right to fixing the actual bottleneck. This is the heart of effective day-to-day e-commerce management.
Building a Daily Workflow for Smarter Decisions
Look, all the ecommerce performance metrics in the world are useless if you don't have a system for acting on them. The goal is to stop being reactive—frantically staring at a dashboard where every blinking number screams for attention—and start being proactive. It's not about tracking everything, all day. It’s about creating an efficient daily check-in that tells you what actually matters.
A structured routine like this turns data from a source of anxiety into a tool for confident decision-making. Think of it like a pilot's pre-flight checklist. They don't inspect every single bolt on the plane each morning; they systematically check the critical systems that ensure a safe, successful flight.
A Three-Tiered Daily Check-In
Your daily workflow needs a sense of priority, moving from the big picture down to the nitty-gritty details. This simple habit stops you from getting lost in the weeds of campaign-level noise before you've even confirmed your overall business is on solid ground. A logical flow helps you pinpoint issues fast.
Here's a simple, three-step process you can knock out in just a few minutes each morning:
Business Health Check (The 30,000-Foot View): Start at the top. Look at your blended Return On Ad Spend (ROAS) and your overall Cost Per Acquisition (CPA). Are you profitable today? Is your cost to acquire a new customer sustainable? This high-level view tells you if the entire engine is running smoothly before you start messing with the individual parts.
Campaign Diagnostics (The 10,000-Foot View): Next, zoom in on your main ad campaigns. Scan for any major shifts in your frontline indicators like Click-Through Rate (CTR) and Cost Per Click (CPC). If CTR suddenly tanks on your top-performing ads, that’s a clear signal something’s wrong, and it points you exactly where to look next.
Operational Health (The Ground-Level View): Finally, check the operational nuts and bolts. Is Ad Frequency creeping up on a key audience? Are you seeing the early signs of Creative Fatigue? This is where you catch problems before they snowball and make sure your campaigns aren’t slowly bleeding efficiency.
Success isn't about staring at a dashboard for hours. It’s about building a system that surfaces the most impactful actions, provides clear rationale, and helps you execute with confidence in minutes.
This methodical workflow ensures you’re making decisions based on the full picture. It stops you from panicking and swapping out creative in an ad campaign when the real problem is a broken discount code on your Shopify store. By turning this into a simple daily habit, you build a smarter, more resilient operation that can adapt and grow—profitably.
Frequently Asked Questions

Diving into e-commerce metrics can feel like learning a new language. You're not alone if you have questions. Let's tackle some of the most common ones that come up for store owners and marketers in the trenches.
What Is the Most Important Ecommerce Metric to Track?
This is the big one, and the answer really depends on your time horizon. If we're talking about the ultimate health check for your entire business, the LTV:CAC (Lifetime Value to Customer Acquisition Cost) ratio is king. It tells you whether you're building a sustainable business or just spinning your wheels.
But for those day-to-day decisions in your ad accounts? You need to keep your eyes glued to ROAS (Return On Ad Spend) and CPA (Cost Per Acquisition). These are your frontline indicators, telling you whether your campaigns are actually making money right now.
How Often Should I Check My Ecommerce Metrics?
You’ll drive yourself crazy if you stare at your ad dashboard all day. The key is to have a rhythm. Think of it in layers.
Daily Check-in: A quick look at frontline metrics like CTR and CPC is smart. This helps you spot immediate problems, like an ad burning out, without getting lost in the noise.
3-Day or 7-Day Windows: This is the sweet spot for analyzing performance metrics like ROAS and CPA. Looking at data over a few days smooths out the daily bumps and gives you a much more reliable picture of what’s actually working.
Monthly or Quarterly Review: Zoom out to look at the big stuff. This is when you dig into LTV and your overall LTV:CAC ratio. These reviews are for steering the ship, not just trimming the sails.
My ROAS Is High, but I'm Not Profitable. Why?
This is a classic—and incredibly frustrating—scenario. A high ROAS feels good, but it only tells you one part of the story: how efficiently you're turning ad dollars into revenue. It says nothing about your actual profit.
The problem usually lies in your margins. Let's say it costs you $75 in total to produce and fulfill a product you sell for $100. In that case, you need a ROAS way over 4x just to break even on that sale after you've paid for the ads. A "high" ROAS might still be losing you money.
Another common trap is getting a great ROAS on a tiny budget. It’s easy to be efficient with a small, hyper-targeted audience, but the real challenge is maintaining that as you try to scale.
The goal isn't just a high ROAS; it's a profitable ROAS that you can maintain as you scale your ad spend.
What Is a Good ROAS for an Ecommerce Business?
You'll hear the 4:1 ratio tossed around a lot—$4 back for every $1 spent. While it's a common benchmark, it’s also generic advice that can be dangerous. The honest answer is: it completely depends on your business.
A brand selling high-ticket items with massive profit margins might be thrilled with a 3:1 ROAS. On the flip side, a store selling low-margin products might need an 8:1 ROAS or even higher just to keep the lights on.
Forget the industry averages. The only number that matters is your own break-even ROAS. Calculate that first, and then you can set a target that actually means something for your bottom line.
Stop drowning in data and start making smarter decisions. SpendOwlAI provides clear, daily actions to improve your ad performance, giving you the confidence to know what to change, what to scale, and what to leave alone. Start your free 7-day trial and see the difference at https://spendowlai.com.