Your Cost Per Customer Acquisition Calculator and 2026 Guide
At its core, a cost per customer acquisition calculator does one simple thing: it divides your total marketing and sales costs by the number of new customers you brought in. The result is a single, powerful number—the average price you pay to win over each new customer.
Your Interactive Cost Per Customer Acquisition Calculator

Before we dive into the weeds of complex formulas and attribution models, let's get you a quick win. The interactive cost per customer acquisition calculator below is designed to give you an immediate, high-level snapshot of your spending efficiency.
Just plug in your total marketing spend and the number of new customers you’ve gained over the same period.
That number it spits out, your Customer Acquisition Cost (CAC), is one of the most critical health metrics for any business. It tells you whether your growth engine is actually profitable or if you're bleeding cash by spending more to acquire customers than they're worth. Think of it as the price tag on each new person who decides to buy from you.
Why Start with a Simple Calculator?
This basic calculation gives you a vital starting point—a baseline from which all deeper analysis begins.
Sure, this first figure doesn't account for all the nuances like team salaries or software fees (we'll get to that). But it provides an instant signal on your performance. For countless founders and small marketing teams I've worked with, this is the first crucial step toward making truly data-driven budget decisions.
Your CAC isn't just a marketing metric; it's a fundamental business metric. It directly impacts your profitability, cash flow, and ability to scale. Understanding it isn't optional if you're serious about long-term success.
To make this crystal clear, let's break down what goes into this simple calculation and what comes out. For a deeper look at how CAC works hand-in-hand with your ad spend efficiency, you might want to check out our guide on calculating your break-even ROAS.
Calculator Inputs and Output Summary
Here’s a quick summary of the data points you'll need for this initial calculation.
Data Point | Description | Example |
|---|---|---|
Total Marketing & Ad Spend | The total amount of money you spent on advertising and marketing activities over a set period. | $10,000 |
New Customers Acquired | The total number of new paying customers gained during that same period. | 200 |
Cost Per Acquisition (CAC) | The resulting average cost to acquire one new customer. | $50 |
With these numbers, you have a solid foundation. Now, we can start peeling back the layers to get an even more accurate and actionable view of your acquisition costs.
Mastering the CAC Formula and Its Essential Inputs
Calculating your Cost per Customer Acquisition (CAC) seems straightforward at first glance. But to get a number you can actually trust to make decisions, you have to go deeper than just ad spend.
The classic formula is a great starting point:
CAC = (Total Marketing Costs + Total Sales Costs) / Number of New Customers
Simple, right? The real work, and where most brands get it wrong, is in defining what actually goes into your "Total Costs." Under-reporting your expenses will give you a dangerously low CAC and a false sense of security. Let’s break down what a truly fully-loaded CAC includes.
What Goes Into Total Marketing Costs?
This bucket should contain every single dollar you spend to generate interest and get people to your site. It’s a lot more than just what you pay Meta or Google.
To get an honest picture, your marketing costs must account for:
Ad Spend: This is the most obvious one. It’s the total cash you’re putting into all your paid channels, from Google Ads and TikTok to influencer collaborations and newsletter sponsorships.
People Costs: Don't forget the humans! This includes the proportional salaries for your in-house marketing team and any fees for agencies, consultants, or freelancers you work with.
Your Tool Stack: Every subscription adds up. Tally the monthly or annual costs for your email platform, analytics tools, design software like Canva, and any SEO tools.
Creative and Content: Any direct costs tied to producing your ad creative, blog posts, videos, or other marketing assets belong here.
Getting these costs right is half the battle. While tracking ad spend is usually easy, figuring out which channels are actually driving results can be tough. If you're struggling with attribution, our guide on setting up UTM parameters for better analytics is a great place to start.
Unpacking Total Sales Costs
Sales costs are all the expenses that happen closer to the final conversion. For most e-commerce brands, these are often lumped in with marketing, but separating them gives you much-needed clarity.
A good rule of thumb I've seen work well: if the cost happens before a customer adds an item to their cart, it’s marketing. If it happens at checkout or is tied directly to the transaction, it’s a sales cost.
Common sales-related expenses include:
Salaries & Commissions: If you have a sales team that handles B2B or high-value orders, their compensation is a direct acquisition cost.
Processing & Platform Fees: Don't forget the cut that platforms like Shopify or payment processors like Stripe take from every single sale.
Discounts & Promotions: This is a big one. You need to isolate the total dollar value of coupon codes and promotions used specifically by new customers.
Once you gather all these figures, you’re moving from a flimsy, vanity metric to a fully-loaded CAC that reflects the true financial reality of your growth efforts. To make this process easier, we’ve put together a quick cheat sheet.
Detailed Breakdown of CAC Inputs
This table breaks down the most common expenses you'll need to track down for an accurate, fully-loaded CAC calculation. It covers what the expense is, provides a few concrete examples, and tells you where you can typically find the data.
Expense Category | Specific Examples | Where to Find This Data |
|---|---|---|
Marketing Costs | Ad spend, agency fees, content creation, salaries, software subscriptions (e.g., Klaviyo, Canva). | Google/Meta Ads Dashboards, Accounting Software (e.g., QuickBooks), Bank Statements |
Sales Costs | Sales commissions, Shopify/Stripe fees, referral program payouts, new customer discounts. | Shopify Dashboard, CRM, Accounting Software, Payroll Records |
New Customers | The total number of first-time buyers acquired within the specified time period. | Shopify Analytics, Google Analytics, CRM Reports |
By meticulously tracking these inputs, you'll have a CAC figure that's not just a number on a dashboard, but a powerful tool for making smarter business decisions.
Getting Real: The Messy Details of True CAC
The basic CAC formula is a great starting point, but it's just that—a start. In the real world, relying on that simple number is like trying to navigate a city with a hand-drawn map. You'll get the general idea, but you’re going to miss the crucial turns that determine whether you actually arrive at your destination.
To move from a surface-level metric to a truly insightful one, you have to dig into the complexities. This is where experienced operators separate themselves from the crowd.
Accounting For Returns and Refunds
One of the first places a simple CAC calculation falls apart is with returns. What happens when a "new customer" sends their product back for a refund? If you don't adjust for this, you're counting a customer who actually generated no revenue and only cost you money.
Let’s walk through a common scenario. You spend $5,000 on ads and acquire 100 new customers. On paper, your CAC is a neat $50.
But then, 10 of those customers return their orders. You didn't actually acquire 100 customers; you acquired 90. That same $5,000 spend now has to be divided by 90.
Your true CAC is now $55.55. That's an 11% jump that was completely invisible before.
I've seen this trip up countless brands. Ignoring returns artificially deflates your CAC and can hide big problems with product-market fit or marketing that over-promises and under-delivers.
Defining The Right Acquisition Window
Another variable that can dramatically skew your numbers is the time period you measure. Are you looking at the last 7, 30, 60, or 90 days? There's no single right answer, but the window you choose frames the entire story.
A short window, like 7 days, might be useful for analyzing a specific flash sale, but it's often too noisy for strategic planning. It completely misses customers who need more time to think before they buy. A 90-day window, on the other hand, gives you a much more stable, big-picture view by smoothing out weekly bumps.
For most e-commerce businesses I work with, a 30-day window strikes the perfect balance. It’s long enough to capture the majority of the buying cycle without being too slow to reflect recent changes in performance.
This chart helps visualize how you can progress from a basic calculation to a more sophisticated one that accounts for these nuances.
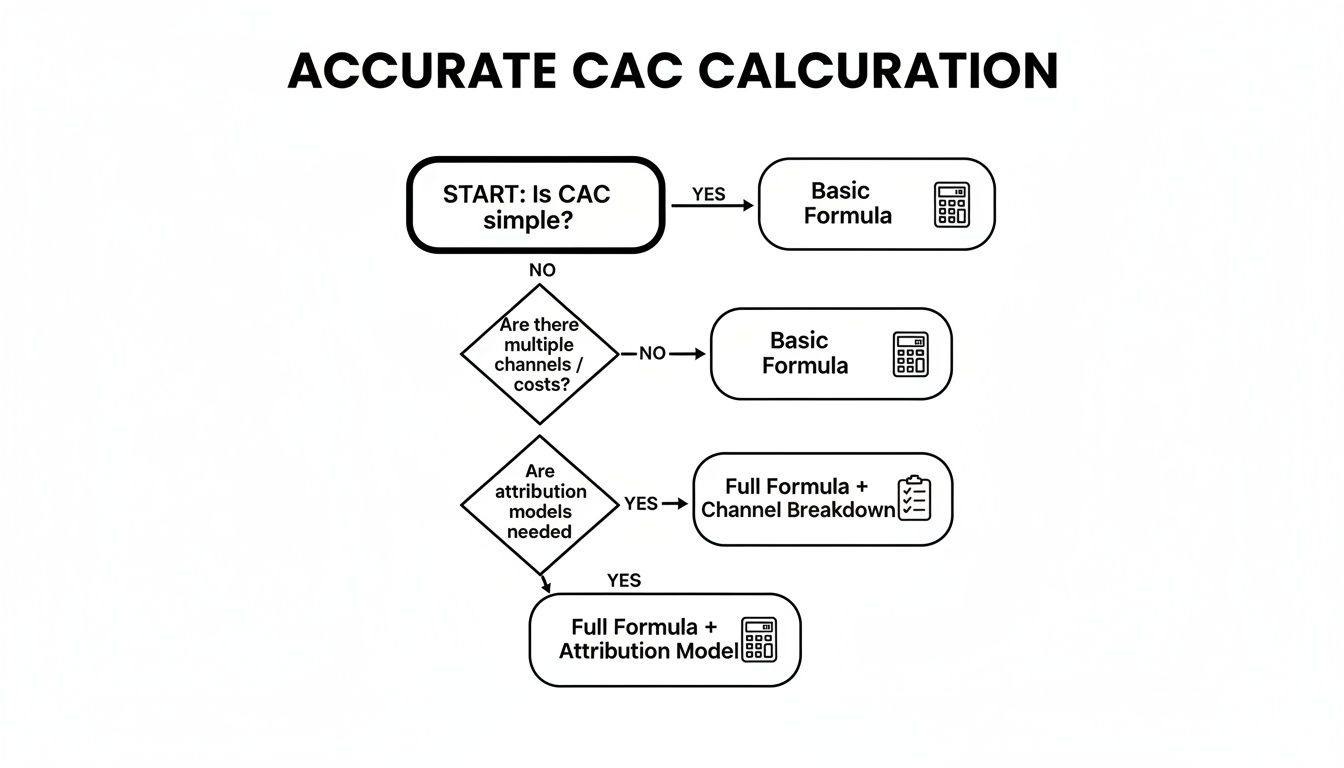
As you can see, getting an accurate CAC means going deeper than just total costs divided by new customers.
The Challenge Of Multi-Touch Attribution
Hardly anyone sees a single ad and immediately buys anymore. The modern customer journey is a winding path. They might discover your brand on TikTok, get retargeted on Instagram, search for you on Google, and finally click a link in an email to make a purchase.
This creates the classic problem of multi-touch attribution. So, which channel gets the credit for the sale? How you answer this question will completely change your channel-level CAC.
Here are the most common models and how to think about them:
Last-Click Attribution: This gives 100% of the credit to the very last touchpoint. It’s simple and clean, but it heavily favors bottom-of-funnel channels and often completely ignores the channels that created the initial awareness.
First-Click Attribution: This model gives all the credit to the first channel a customer ever interacted with. It’s great for understanding which channels are best for discovery but fails to reward the touchpoints that actually sealed the deal.
Linear Attribution: This approach splits the credit evenly across every single touchpoint in the journey. It's democratic, but it wrongly assumes a quick glance at a display ad had the same impact as an in-depth product video they watched.
Your choice of attribution model should reflect your business goals. If you're a performance marketer laser-focused on immediate ROI, last-click can offer a clear, if incomplete, picture. But if you’re trying to build a brand for the long haul, a model that gives credit to the entire journey will prevent you from cutting off top-of-funnel channels that are quietly building your future customer base.
Calculating CAC At The Channel And Product Level
A blended CAC gives you a high-level view of your acquisition engine's health—the "what." But to find real leverage for growth, you need to dig into the "where" and the "why." This means getting more granular than a single, aggregate number and calculating your cost per customer acquisition for each part of your strategy.
This is where your analysis gets truly actionable. Knowing your CAC for Meta Ads versus Google Ads versus influencer marketing immediately shows which channels are pulling their weight and which ones are just draining your budget. For most e-commerce brands, this is the key to unlocking smarter ad spend.
Pinpointing Your Channel-Specific CAC
To get a channel-level CAC, you need to isolate the costs and new customers tied to each specific platform. It requires clean data tracking, but the payoff is enormous.
The formula is a simple variation of the main one:
Channel CAC = Total Spend on Channel / New Customers from Channel
Gathering the right inputs is the most important part. Here’s how it breaks down for a few common channels:
Meta Ads (Facebook & Instagram): Just pull your total ad spend from the Meta Ads Manager for your time period. Then, in your analytics platform, pinpoint the number of new customers attributed specifically to your Meta campaigns.
Google Ads: Add up the costs from your Search, Shopping, and YouTube campaigns in the Google Ads dashboard. Match that against the new customers acquired from those specific efforts.
Influencer Marketing: This one can be a bit tricky. Make sure you include the influencer's fee, the cost of any gifted products, and all associated shipping costs. You can then track new customers by using their unique discount code or affiliate link.
This channel-level view often reveals some hard truths. I've worked with brands that were celebrating a "low" blended CAC, only to discover it was masking a wildly expensive channel being propped up by a single, highly profitable one. Finding that out is the first step to reallocating your budget for maximum impact.
Don't just rely on last-click data. It’s crucial to understand how different channels contribute at various points in the customer journey. You can learn more about how to approach this with our guide on marketing attribution software.
Going Deeper with SKU-Level CAC
For brands with more than one product, even channel-level CAC is only half the story. If you're selling a high-margin $150 hero product alongside a low-margin $25 entry item, lumping their acquisition costs together is completely misleading. The profitability of those two customers is worlds apart.
This is where SKU-level analysis comes in. By connecting acquisition costs to the specific products people buy first, you can answer critical business questions. Are your ads actually selling your high-margin items, or are you spending $40 to acquire customers who only buy a $25 product?
Let's walk through a practical example.
A Shopify Store Example
Imagine a Shopify store called "GlowUp Skincare" that spends $5,000 on Google Ads in a month. This campaign brings in 100 new customers, giving them a tidy Google Ads CAC of $50. Not bad on the surface.
But once they break it down by the first product purchased, the picture changes dramatically:
First Product Purchased | Number of New Customers | Spend to Acquire | CAC Per Product | Product Margin | Profit Per Acquisition |
|---|---|---|---|---|---|
"Radiant Serum" ($100) | 50 | $2,500 | $50 | $70 | $20 |
"Lip Balm" ($15) | 50 | $2,500 | $50 | $5 | -$45 |
In this scenario, every time GlowUp acquires a customer for their low-margin Lip Balm, they instantly lose $45 on that first sale. This is a game-changing insight. It proves that while the channel-level CAC looks fine, the campaign is deeply unprofitable for half the customers it acquires.
This level of granular data—moving from a blended figure to a channel- and SKU-specific cost per customer acquisition calculator—is what provides the clarity needed to refine ad targeting, adjust creative, and build a truly profitable growth machine.
Alright, you've calculated your CAC. Now what?
Knowing your number is one thing, but the real work starts when you figure out what that number is actually telling you. This is where you move from just tracking metrics to making them work for you.
A raw CAC figure is pretty meaningless on its own. A $50 CAC could be a massive win for a mattress company but a total disaster for someone selling socks. Context is everything. The most important piece of context you need is your Customer Lifetime Value (LTV)—the total amount of revenue you expect to earn from a customer over their entire relationship with your brand.
Benchmarking with the LTV:CAC Ratio
This brings us to the LTV:CAC ratio, one of the most critical health metrics for any growing business. It cuts straight to the point and answers the big question: "Are we paying a sustainable price to acquire customers compared to what they're worth to us in the long run?"
There's no single magic number, but a 3:1 ratio (your LTV is three times your CAC) is widely seen as the benchmark for a healthy, scalable business.
Here’s a quick breakdown of what different ratios are telling you:
Below 1:1: You're losing money on every single customer you bring in. This is a five-alarm fire. You need to act immediately.
Exactly 1:1: You’re just breaking even on the acquisition itself. This is a precarious spot because it leaves zero margin for your operating costs, salaries, or R&D. You're treading water.
A solid 3:1: This is the sweet spot. It signals a profitable and efficient marketing engine with enough margin to cover all your costs and reinvest back into growth.
5:1 or higher: This is fantastic, but it might also be a sign you're leaving money on the table. An exceptionally high ratio could mean you’re under-investing in marketing and have an opportunity to grow much faster.
Once you know where you stand, you can start pulling the right levers to improve that ratio by actively lowering your CAC.
High-Impact Tactics to Reduce Acquisition Costs
Lowering your CAC isn't about gutting your ad budget and hoping for the best. It's about wringing more value and efficiency out of every dollar you spend. Here are a few of the most effective strategies I’ve seen work time and time again.
Boost Your Conversion Rate (CRO) Improving your website's conversion rate is the single most powerful way to lower your CAC. Why? Because you're making your existing traffic, which you've already paid for, more valuable. Even tiny tweaks can have an outsized impact.
Focus on the low-hanging fruit first:
Align your landing pages. Does your ad promise "50% Off" but the landing page barely mentions it? That's a disconnect. Make sure the message, headline, and imagery are perfectly consistent from ad to page.
Crush slow load times. Every second your site takes to load is another reason for a potential customer to bounce. In 2024, speed isn't a feature; it's a basic requirement.
Simplify your checkout. How many fields are you really making people fill out? Get rid of anything that isn't absolutely necessary. Friction is the enemy of conversion.
Refine Your Ad Targeting and Audience Stop throwing money away by showing ads to people who will never buy. The tighter your targeting, the more efficient your ad spend becomes. Dive into your analytics, identify the characteristics of your most profitable customers, and then build campaigns laser-focused on reaching more people just like them.
This is also where monitoring comes in. You need to watch for signs of audience saturation, which is a clear signal that your targeting is getting stale.
When you see a chart like this one from SpendOwlAI, it’s telling you that the same people are seeing your ads over and over. Their effectiveness plummets, and your CAC starts to climb. That's your cue to either find a new audience or drastically change up your creative.
When your CAC starts creeping up without a clear reason, creative fatigue and audience saturation are two of the most common culprits. Actively monitoring for these signals allows you to take corrective action before your performance craters.
Fight Creative Fatigue Even your best-performing ad has a shelf life. The moment your audience has seen it too many times, it becomes invisible. This is creative fatigue, and it will quietly kill your campaigns if you let it.
The only way to fight it is by systematically introducing new ad creative. I'm talking about a steady pipeline of new images, new videos, and fresh copy. This keeps your brand from going stale in the feed and helps maintain a stable, lower CAC over the long haul.
Your Top CAC Questions, Answered
Once you've got the basics down, the real questions start to surface. Let's walk through a few of the ones that operators in the trenches ask most often when they start digging into their Customer Acquisition Cost.
What Is a Good CAC?
That's the million-dollar question, isn't it? The only honest answer is that a "good" CAC is completely relative to your business. A $500 CAC might be fantastic for a SaaS company with high-value subscriptions, but it would sink a DTC brand selling $30 t-shirts.
Instead of chasing a magic number, focus on your LTV:CAC ratio. The classic benchmark for a healthy, sustainable business is 3:1 or better. This means you're making at least three dollars back over the lifetime of a customer for every dollar you spend to get them in the door. If you’re below that, your growth engine might be running on fumes.
The goal isn't just a low CAC; it's a profitable CAC. Shift your focus from the absolute cost to its relationship with your Lifetime Value.
How Often Should I Calculate My CAC?
Your calculation cadence really depends on the speed of your business. For most e-commerce brands running paid ads, a monthly calculation is the sweet spot. It gives you a reliable pulse check on performance without getting bogged down by the random ups and downs of daily data.
That said, you’ll want to pull the numbers on other schedules, too:
Quarterly: This is perfect for spotting broader trends and making bigger strategic calls on where your budget should go.
Per Campaign: Always calculate CAC for specific campaigns. It’s the only way to truly know if that new channel or big promotion was a winner.
Just try to avoid calculating it daily. The data is usually too volatile to give you anything actionable and can lead to knee-jerk decisions.
Why Is My CAC Different From My CPA?
This is a common point of confusion, but the distinction is critical. People often use these terms interchangeably, but they measure very different things.
CPA, or Cost Per Action, is the cost of a specific conversion that isn't necessarily a new paying customer. It could be a lead, an email signup, or an app install.
CAC, on the other hand, measures one thing and one thing only: the total cost to acquire a brand-new, paying customer.
For example, your CPA for a newsletter signup might be a lean $2. But if you know it takes 50 of those signups to generate one first-time buyer, your actual CAC from that funnel is $100. Getting this right is fundamental to your financial planning, especially when you're using a cost per customer acquisition calculator to make budget decisions.
Ready to stop guessing and start executing with confidence? SpendOwlAI delivers a ranked list of daily actions for your ad accounts, turning noisy data into clear, explainable insights. Get the guardrails you need to lower CAC and scale profitably. Start your free 7-day trial at https://spendowlai.com.