A Modern Conversion Optimization Strategy for Paid Media
So, what exactly is a conversion optimization strategy? It's really just a methodical way to get more of your website visitors to do what you want them to do—turning the traffic you already have into more revenue. For those of us in the paid media trenches, it's about ditching the reactive, gut-feel campaign edits and adopting a structured process of auditing, hypothesizing, testing, and then scaling what actually works. It's about letting data, not guesswork, drive your decisions.
Why Your Paid Media Needs a Real Strategy

If you're managing paid media for an e-commerce brand, you know the drill. You’re caught in a never-ending cycle of tweaks: adjusting bids, swapping out creatives, and tweaking audiences based on the chaotic daily metrics from Meta or Google. This constant tinkering often resets the ad platform’s learning phase, which just creates more volatility and burns through your budget.
A genuine conversion optimization strategy gives you the guardrails to stop the madness. Think of it as a repeatable system that clarifies what to change, when to change it, and—maybe most importantly—what to leave alone.
The Problem with Reactive Adjustments
Operating without a structured approach is a recipe for headaches. I see it all the time with teams struggling with the same issues:
Confusing Performance: It’s almost impossible to tell if a dip in ROAS is a real problem or just a random statistical blip.
Wasted Spend: Money gets poured into campaigns that are either scaled too early or edited into oblivion.
Decision Fatigue: Without a clear framework, every small change feels like a high-stakes gamble.
This guide is designed to give you a clear path forward. We'll walk through a framework that helps you turn messy performance data into a concrete, actionable plan.
The core goal here is to build a system that prevents you from chasing noise. By focusing on validated learnings, you can make changes with confidence, knowing each adjustment is part of a deliberate strategy—not just a reaction to a bad day.
The Untapped Opportunity in Testing
In the hyper-competitive world of e-commerce, solid A/B testing can drive up to a 49% increase in conversions. Yet, it's shocking that only 44% of companies are actually doing it consistently. This gap represents a massive opportunity for performance marketers bogged down by noisy ad data. You can dig into the full research on conversion optimization statistics to learn more.
Instead of just guessing, a proper strategy gives you a repeatable method for continuous improvement. It’s how you build a more resilient, predictable, and profitable paid media engine.
Auditing Your Entire Performance Funnel
A solid conversion optimization strategy doesn't kick off with a bunch of random A/B tests. It starts with a clear, honest look at what’s actually happening across your entire customer journey. For paid media managers, this means getting past surface-level metrics like Click-Through Rate (CTR) and digging into the whole funnel, from the first ad click all the way to the "thank you" page.
You have to put on your detective hat. Your job is to piece together clues from Meta, Google, and Shopify to find the real friction points. A high CTR on a Meta ad, for example, feels like a win. But if that ad sends traffic to a landing page with an 80% bounce rate, you're just paying to fill a leaky bucket. That's exactly the kind of disconnect a good audit is meant to uncover.
Connecting Ad Performance to On-Site Behavior
The first move is to break down the walls between your ad platforms and your website analytics. The goal is to map out the user's path and pinpoint where they lose steam. Instead of just staring at your ROAS in isolation, you need to start asking sharper questions.
Let’s say you notice a top-performing Google Shopping campaign is suddenly taking a nosedive. A quick glance inside Shopify might show that the campaign's best-selling SKU just went out of stock. Without connecting those dots, you might have mistakenly killed a campaign that was actually working perfectly fine.
A full-funnel audit isn’t just about finding what's broken; it's about understanding the complete story your data is trying to tell you. It transforms you from a reactive campaign manager into a proactive strategist who can anticipate problems before they tank your metrics.
Your Platform-Specific Audit Checklist
To really get to the bottom of things, you need to look for specific red flags within each platform. Here’s a practical checklist to guide your investigation and help you zero in on the biggest opportunities for improvement.
On Meta Ads:
Creative Fatigue: Is your ad frequency creeping up while your CTR is dropping? That’s a classic sign your audience is tired of seeing the same ad.
Audience Saturation: Seeing your reach flatline and your CPM (Cost Per Mille) steadily rise for a specific audience? You might have tapped out the most engaged users.
Comment Sentiment: Are the comments on your ads turning negative? This qualitative feedback is often a canary in the coal mine, telling you why an ad is about to fail.
On Google Ads:
Search Query Drift: Are your Performance Max or broad match campaigns pulling in junk search terms that just burn cash? Get into your search query reports and hunt for low-intent keywords.
Impression Share Decline: Losing ground to competitors on your most profitable keywords? It could be time to rethink your bids or work on your Quality Score.
Landing Page Experience: Is Google rating your landing page experience as "Below Average"? This directly hurts your Ad Rank and drives up costs, flagging a major UX problem that needs your attention.
On Shopify or Your E-commerce Platform:
Funnel Drop-off Points: Where are people bailing? A massive drop-off between "Add to Cart" and "Initiate Checkout" often screams "surprise shipping costs!" or a clunky cart page.
SKU-Level Performance: Which specific products are driving your best (and worst) results from paid traffic? A single dud product page can drag down an entire campaign's profitability.
Site Speed: Does your product page take more than three seconds to load? Slow load times are absolute conversion killers, especially for mobile traffic coming from social ads. For more on this, our guide to website conversion optimization offers deeper strategies.
By methodically working through this checklist, you'll end up with a diagnostic report that shines a light on the most urgent issues. This report becomes the foundation of your entire optimization strategy, ensuring every test you run is focused on solving a real problem that will actually move the needle.
Building And Prioritizing Smart Hypotheses
Your funnel audit is complete. You've uncovered the leaks—the drop-off points, the confusing steps, the moments where potential customers bail. But that data is just a diagnosis. Now it's time to write the prescription.
This is where you move from observation to action by building smart, testable hypotheses. A vague idea like "improve the landing page" isn't going to cut it. A real hypothesis is sharp and measurable. For instance, after seeing a high bounce rate on a key product page, you might form this hypothesis: "We believe changing the main CTA from 'Shop Now' to 'Get 20% Off Today' will increase add-to-carts by 10% because it creates a clear and immediate sense of value."
See the difference? One is a wish, the other is a plan with a clear target.
Crafting A Testable Hypothesis
A solid hypothesis isn't just a guess; it's a logical statement that connects what you saw in your data to a specific change and a predicted result. It’s the framework that keeps your team from just throwing spaghetti at the wall to see what sticks.
I’ve always found this simple structure to be incredibly effective for keeping everyone focused:
Because we saw [Data/Observation]... (e.g., "our analytics show a 70% drop-off at the shipping information step...")
We believe that changing [Element]... (e.g., "by displaying a shipping cost estimator on the product page itself...")
Will result in [Outcome]... (e.g., "a 15% decrease in abandoned carts...")
Because [Rationale]... (e.g., "this change will eliminate sticker shock at the end of the checkout process and build trust much earlier.")
This isn't just about formality. This structure forces you to justify why you think a change will work. It turns a random idea into a strategic experiment, which means you learn something valuable even if the test doesn't produce a win.
This flowchart shows exactly how users move from an ad to the final purchase, highlighting where these hypotheses can have the biggest impact.
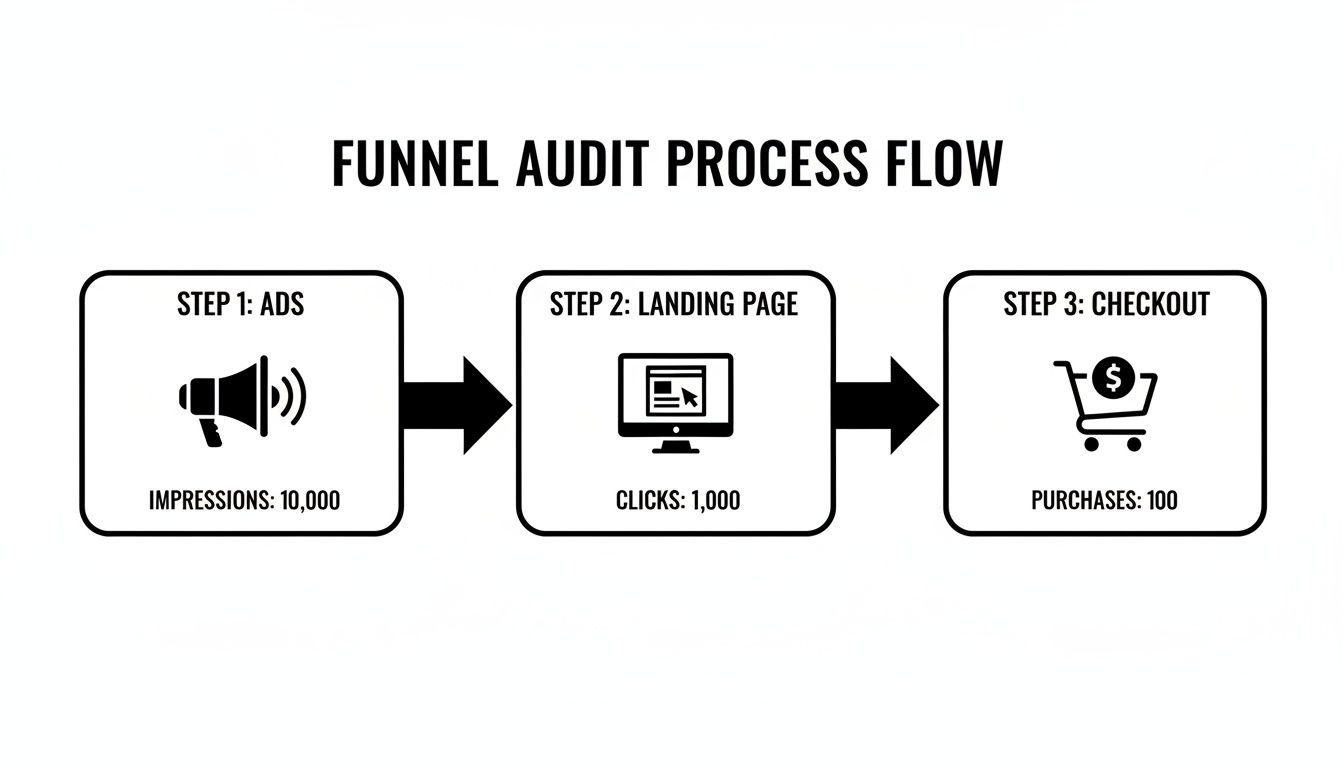
Thinking about your funnel this way helps you see exactly where the biggest opportunities for improvement lie.
Prioritizing What To Test First
Let’s be honest—you're going to have way more ideas than you have time or traffic to test. This is a good problem to have, but it means you need a ruthless prioritization system. Without one, the loudest voice in the room often wins.
We use a simple but powerful Impact vs. Effort matrix to cut through the noise. It forces you to score every idea against two core criteria:
Potential Impact: If this works, how big of a deal is it? (Score 1 for a tiny bump, 5 for a game-changer).
Implementation Effort: How much time and how many resources will this take to get live? (Score 1 for a 30-minute text change, 5 for a project that needs a developer for two weeks).
The whole point is to find the quick wins—the high-impact, low-effort ideas that can build momentum fast. This isn't about being lazy; it's about being efficient with your team's most valuable resource: their time.
For example, testing new button copy is a classic low-effort, potentially high-impact idea. On the other hand, completely redesigning your mobile navigation is a massive undertaking. You'd better be damn sure the potential payoff is huge before you commit to something that heavy.
We put everything into a simple table to make it crystal clear what to work on next.
Hypothesis Prioritization Matrix Example
Here's a look at how this plays out in practice. By scoring each idea, you create a clear, data-informed roadmap that anyone on the team can understand.
Hypothesis | Potential Impact (1-5) | Implementation Effort (1-5) | Priority Score (Impact/Effort) |
|---|---|---|---|
Change CTA copy on product page | 4 | 1 | 4.0 |
Add trust badges (e.g., secure checkout) to the cart page | 3 | 1 | 3.0 |
Test a new hero image on the homepage | 3 | 2 | 1.5 |
A/B test offering free shipping vs. a flat rate | 5 | 4 | 1.25 |
Completely redesign the mobile navigation menu | 5 | 5 | 1.0 |
Right away, you can see that changing the CTA and adding trust badges are the no-brainers. They offer the best bang for your buck. This simple process removes emotion and ego from the equation, ensuring your conversion optimization strategy stays focused on what truly matters: boosting ROAS and driving more sales.
Designing and Running Clean Experiments
Alright, you’ve got a prioritized list of smart hypotheses. Now it’s time to move from planning to action. This is where your conversion optimization strategy gets real—designing and running experiments that actually give you trustworthy results.
The goal isn't just to "test stuff." It’s about running clean, reliable experiments that cut through the noise and give you data you can confidently act on.
A sloppy test is genuinely worse than no test at all. It can easily send you chasing a false positive, leading you to roll out a "winner" that was just random chance. And before you know it, you've accidentally tanked performance. To avoid that pitfall, every experiment needs a solid, non-negotiable foundation.
The discipline of a clean experiment is what separates a professional optimization program from a team just throwing ideas at a wall. It’s about being methodical, patient, and committed to letting the data speak for itself, even when it’s not what you hoped to see.
The Anatomy of a Rock-Solid Test Plan
Before you launch any A/B test, whether it’s in Meta Ads Manager or on a Shopify product page, you need to document the plan. I know, it sounds like extra work, but this simple step forces clarity and gets everyone on the same page about what you're testing, why, and what success actually looks like.
Here's what every good test plan needs to have nailed down:
Primary Hypothesis: The clear, measurable statement you already crafted. No fuzzy goals.
Primary KPI: The one metric that will decide if the test is a win or a loss. For an ad creative test, this might be Click-Through Rate (CTR). For a landing page, maybe it's Add-to-Carts. Just pick one.
Secondary KPIs: These are the other metrics you’ll watch for context. For instance, a new ad could get a higher CTR (your Primary KPI) but a lower Conversion Rate (a Secondary KPI). That’s a huge red flag that it’s attracting the wrong people.
Test Duration and Sample Size: How long will this run? This can't be a gut feeling. Use a sample size calculator to figure out how many impressions or visitors you need to hit statistical significance—usually a 95% confidence level. Whatever you do, don't stop a test early just because one version is ahead.
Control and Variation(s): A crystal-clear description of the original version (Control) and the specific change you’re making in the new one (Variation).
Documenting all this ensures you're isolating a single variable. If you change the headline, the image, and the CTA all at once, you’ll have no idea which element actually moved the needle.
Practical Test Examples for Your Tech Stack
Let’s get this out of theory and into the real world. Here’s how this looks inside the tools you’re probably using every day. The principles are the same, but the execution details differ.
Running a Creative Test in Meta Ads
Let's say your audit flagged creative fatigue in a top-performing ad set. Your hypothesis is that a user-generated content (UGC) video will outperform your polished studio ad because it feels more authentic and trustworthy.
The Setup:
Jump into the ad set you want to test within Meta Ads Manager.
Duplicate your current ad (this is your Control).
In the new, duplicated ad (your Variation), swap out only the creative with the UGC video. Seriously, don’t touch the headline, copy, or CTA.
Use Meta’s built-in A/B test feature to ensure the budget and audience are split evenly. This is key.
Set your Primary KPI as Cost Per Purchase. Now, let it run. Let Meta tell you when you have enough data for a confident result.
Testing a Landing Page Offer in Shopify
Your analytics show a huge drop-off on a key product page. You believe that tweaking the offer from a simple "Buy Now" to a "Buy One, Get One 50% Off" bundle could lift both average order value and overall conversions.
The Setup:
Use a Shopify A/B testing app like Shogun or VWO. These tools let you create and deploy variations without bugging a developer.
Create a duplicate of your product page (the Control).
On the new page (the Variation), update the headline, product description, and pricing to reflect the new BOGO bundle.
In the app, set up the experiment to split incoming traffic 50/50 between the original and the new page. The most important thing here is to make sure your tracking is flawless. If you need a refresher on tracking traffic sources, check out our guide on using UTM parameters for Google Analytics.
Your Primary KPI would likely be the page’s conversion rate. You’ll need to let this run until you have at least several hundred conversions per variation to trust the result.
By sticking to this structured approach, you build a reliable engine for learning. Every test—win or lose—gives you a valuable insight that sharpens your understanding of your customers and makes your next hypothesis even smarter.
Analyzing Results and Scaling Your Wins
Once your A/B test wraps up, the real work is just getting started. It’s easy to get excited the moment a variation pulls ahead, but that initial rush can be misleading. Now comes the hard part: figuring out if you have a real winner or just statistical noise, and then deciding what to do next.
This is where you turn raw data into actual business growth. A single successful test is nice, but building a system to learn from and scale those wins is what creates a true growth engine. Honestly, this is also where most teams drop the ball, either by jumping the gun on shaky data or by failing to squeeze every drop of value out of a clear victory.
Decoding Your Test Results
First thing's first: you have to be sure the result is legitimate. Before you declare a winner and start celebrating, you need to hit statistical significance. The industry standard is a 95% confidence level, and this isn't just some nerdy stat—it's your safety net against making huge business decisions based on random luck. Your testing tool will handle the math, but it's on you to check it.
With significance confirmed, it's time to look beyond the main KPI. Sure, the new landing page drove more conversions, but did it also kill your average order value? Did that hot new ad creative get a ton of clicks but attract low-quality leads who ghost you later? These secondary metrics tell the whole story.
A "win" that torpedoes another key business metric isn't a win. It’s a trade-off. You need to understand that trade-off completely before you even think about rolling out a change to 100% of your audience. This is how you avoid optimizing yourself into a corner.
Documenting Everything—Wins and Losses
Every single test, win or lose, is a lesson. In my experience, the failed tests are often more valuable because they teach you what doesn't work for your audience, saving you from making the same expensive mistakes down the road. This is why keeping a central "learning library" or a simple test log is non-negotiable.
For every experiment, you should be tracking:
The Original Hypothesis: What did you set out to prove?
A Screenshot/Link: Visual proof of the control and the variation(s).
Key Data: The final numbers—conversion rates, sample size, confidence level, and any important secondary metrics.
The Outcome & Takeaway: A simple, one-sentence summary. For example, "Changing CTA to focus on the discount boosted add-to-carts by 12%, confirming our audience is very price-sensitive."
This log quickly becomes one of your team's most valuable assets. When you're planning the next quarter or a new hire comes on board, you have a detailed history of what's been tried, what worked, what bombed, and most importantly, why.
Scaling Winning Variations Systematically
Okay, you've got a validated winner. Now it's time to roll it out and actually bank the gains. But don't just flip a switch and move on. A structured rollout maximizes your impact and keeps risk low.
Segmented Rollout: Instead of going from 0 to 100 instantly, phase it in. For a website change, maybe you start by rolling it out to 50% of traffic. For a new ad creative, you could slowly introduce it into your other ad sets. This gives you a chance to monitor its performance in the wild without betting the farm.
Monitor Post-Launch Performance: The lift you saw in a controlled test doesn't always stick around. Keep a close eye on your KPIs for a few weeks after the full rollout. Sometimes a "novelty effect" inflates test results, and performance drifts back to normal over time. You need to make sure the lift is real and sustained.
Create a Feedback Loop: The insight from one test should be the fuel for the next one. If that CTA test was a home run, what does that tell you? Maybe your next hypothesis should be about testing urgency-based copy in your product descriptions. Each result should spark new, smarter ideas.
Of course, this whole process hinges on having data you can trust. To make sure you're correctly tying conversions back to the right touchpoint, a solid attribution model is essential. You can get a deeper understanding of your options in our guide to marketing attribution software. By analyzing results with discipline and scaling your wins methodically, you stop running one-off experiments and start building a reliable system for growth.
Got Questions About Conversion Optimization? We've Got Answers
Even with a solid plan, jumping into a structured conversion optimization process can bring up a lot of practical questions. When paid media teams move from making reactive tweaks to running deliberate tests, a few common hurdles always seem to pop up.
Let's clear the air on some of the most frequent questions I hear. This is your go-to guide for handling the real-world, day-to-day challenges of running a CRO program.
How Often Should I Be Running A/B Tests in My Ad Accounts?
This really comes down to your traffic and resources. An e-commerce store with high daily traffic might have enough data to run a meaningful new test every single week. But if you're working with a smaller account, your focus should shift to quality over quantity. Aim for one well-defined, high-impact experiment each month.
It's so much better to run one great test on a major hypothesis than five small, inconclusive ones that teach you absolutely nothing. The non-negotiable rule is to let your tests run long enough to get a statistically significant result. For a popular ad, that might only take a few days. For a lower-traffic landing page, you might need to be patient for a few weeks.
Rushing a test is one of the fastest ways to get misleading data. Let the numbers tell the story and wait for statistical confidence—otherwise, you're just making decisions based on random noise.
What Are The Biggest CRO Mistakes to Avoid?
I see teams stumble over the same things all the time. If you can sidestep these common pitfalls, you’ll be way ahead of the game.
The most common mistakes I see are:
Testing too much at once. It’s so tempting, but if you change the headline, image, and CTA in one test, you have no idea which element actually made the difference. Isolate one variable at a time so you know what truly works.
Calling it quits too early. A variation might pull ahead on day one, but that’s often just random chance. You have to wait for the data to mature and reach statistical significance before you can confidently declare a winner.
Ignoring the small wins. A 5% lift might not feel like a world-beater, but those small, incremental gains compound dramatically over a year. They all add up.
Operating without a process. This is the fast track to running random, disconnected tests that don't build on each other. A documented strategy ensures every experiment is a stepping stone to a larger goal.
Over-editing campaigns. Constantly fiddling with ads based on daily performance blips will just keep resetting the ad platform's learning phase. This creates more volatility, not less. Look at weekly trends instead.
Steering clear of these simple blunders will help your CRO program build real, sustainable momentum.
Can I Do CRO Without a Huge Budget or Team?
Absolutely. Conversion optimization isn't about expensive tools; it’s a mindset and a process. Small, scrappy teams can get incredible results by being systematic.
You don't need a massive software budget to get started. Free tools like Google Analytics are more than powerful enough to show you where the biggest drop-offs are in your funnel. Once you know that, you can run simple A/B tests directly within the platforms you already use, like Meta Ads or Shopify.
For example, you could easily:
Test two different headlines on a Meta ad.
Swap out the hero product image on a Shopify page.
Change the button color on your highest-traffic landing page.
The key is to stay focused. Find the single biggest point of friction you uncovered in your audit, form one clear hypothesis, and test it. The core principles of good CRO apply at any scale.
How Do I Know If My Test Results Are Statistically Significant?
Think of statistical significance as the final checkpoint. It’s what confirms your result is most likely due to the change you made, not just random luck. You absolutely cannot declare a winner without it.
Most modern A/B testing platforms have this built right in, and they're usually aiming for a 95% confidence level. That means you can be 95% sure that the difference you’re seeing between your versions is real and repeatable.
If you’re running a test more manually, you can use a free online tool like an A/B test significance calculator. You just plug in the numbers—visitors (or impressions) and conversions for your original "control" and your new "variation." The tool does the math and tells you the confidence level.
Reaching that statistical threshold is what gives you the green light to roll out a winning change to your entire audience, knowing the decision is backed by solid data, not just a gut feeling.
Ready to stop guessing and start executing with confidence? SpendOwlAI delivers a ranked list of what to change in your ad accounts today, complete with transparent rationale. Get clear, explainable actions ordered by impact to prevent waste and save time. Start your free 7-day trial and see the difference.