Your Essential Breakeven ROAS Calculator for E-commerce Ads
It's easy to get excited about a high Return on Ad Spend (ROAS), but that number alone doesn't tell you if you're actually making money. The most critical metric you need to nail down is your breakeven ROAS. This tells you the exact point where your ad revenue covers all your product and advertising costs.
If you dip below this number, you're losing money on every sale your ads bring in. Period.
Why Breakeven ROAS Is Your North Star Metric

Chasing a high ROAS without context is a dangerous game. I’ve seen it happen countless times: a DTC brand is celebrating a killer 4x ROAS on their latest Meta campaign. On the surface, it’s a home run—they’re making $4 for every $1 spent.
But then reality hits. Once you factor in the cost of goods, shipping, fulfillment, and payment processing fees, they might discover their actual profit margin is a slim 20%. In that all-too-common scenario, their real breakeven point is actually a 5x ROAS.
That celebrated 4x ROAS? It's actively losing them money on every single order. This is how e-commerce brands scale themselves right out of business—by focusing on revenue instead of profit. A breakeven ROAS calculator is the guardrail that prevents this.
From Gut Feelings to Data-Backed Decisions
Once you know your breakeven ROAS, everything about how you manage your Meta and Google Ads accounts changes. Guesswork disappears, replaced by a hard, non-negotiable floor for performance.
This single number gives your team immediate clarity. They can confidently decide what to scale, what to pause, and what to optimize.
Your internal conversations start to sound different:
"Should we increase the budget?" turns into "Is this campaign's ROAS safely above our breakeven point?"
"Is this ad set working?" becomes "Is this ad set actually profitable, or is it just burning cash?"
"Can we afford this CPA?" shifts to "Are we acquiring customers profitably from their very first purchase?"
The Industry Standard for Profitability
This focus on the bottom line isn't just a nice-to-have; it's the foundation of a healthy business. Across the e-commerce world, a typical breakeven ROAS lands somewhere between 3x and 4x (or 300-400%).
That means many businesses need to generate $3 to $4 in revenue for every dollar of ad spend just to cover costs, let alone turn a profit. This benchmark underscores why knowing your specific number is so critical.
By defining the precise point where ad spend equals profit, breakeven ROAS becomes the ultimate tool for sustainable growth. It ensures that as you scale your advertising, you're also scaling your profits—not your losses.
At the end of the day, a standard ROAS metric is just a revenue story. To see the full picture, you need to understand how that revenue translates into profit. For a refresher on the basics, our guide on what ROAS is in digital marketing is a great starting point.
Using a breakeven ROAS calculator gives you the context you need to turn raw advertising data into smart, profitable business decisions.
Gathering the Data for an Accurate Calculation

Let's get one thing straight: your breakeven ROAS calculator is only as reliable as the numbers you put into it. Garbage in, garbage out. If you're just ballparking figures or using vanity metrics, you're setting yourself up for a dangerously misleading result. To calculate a number you can actually bet your budget on, you need to roll up your sleeves and pull precise data from your e-commerce and ad platforms.
Think of it like building a house. You wouldn't just guess the measurements for the foundation, would you? The same principle applies here. Precision is everything when you're building a financial guardrail for your ad spend.
Unpacking Your Core Unit Economics
Before we even think about ads, we have to get crystal clear on the fundamental numbers that dictate whether each sale makes or loses money. These are your unit economics, and they’re the bedrock of this entire exercise. Don't go by what you think they are; pull these figures directly from your Shopify analytics or whatever e-commerce backend you use.
Here are the primary inputs you'll need:
Average Order Value (AOV): This isn't a guess. Log into your e-commerce platform and find the actual AOV for a relevant period, like the last 90 days. That's your true, data-backed starting point.
Cost of Goods Sold (COGS): This is the direct cost of the products you sell. You’ll need to dig into your inventory system or accounting software to get an accurate average COGS per order.
Gross Profit Margin: This is the big one. It's the percentage of revenue you have left after accounting for the cost of your products. The formula is simple:
(AOV - COGS) / AOV. For instance, with a $100 AOV and $40 COGS, your gross profit is $60, which gives you a 60% gross margin.
Your breakeven ROAS is fundamentally tied to your gross margin. A business with a 70% margin can remain profitable at a much lower ROAS than a business with a 30% margin, making this the most important input to get right.
Accounting for the "Hidden" Variable Costs
This is where I see so many businesses stumble. They calculate their margin based on COGS and stop there, completely ignoring the other variable costs that chip away at the profit from every single order. When you do this, you artificially lower your breakeven point and trick yourself into thinking unprofitable campaigns are winners.
These are the costs you absolutely cannot forget:
Payment Processing Fees: Stripe, Shopify Payments, PayPal—they all take a piece of the pie. It's usually a percentage plus a small fixed fee (e.g., 2.9% + $0.30). Check your recent statements to find your actual effective rate.
Shipping and Fulfillment Costs: What does it really cost you to get an order out the door? This isn't just the postage. It includes boxes, packing materials, and the labor from your 3PL or warehouse team.
Discounts and Returns: If you run sales often or deal with a lot of returns, this has to be factored in. Calculate the average discount you give and the average cost of processing a return, then treat them as a cost against each order.
Finding these numbers might take a little digging, but it's non-negotiable for an accurate breakeven ROAS calculator. The best practice is to combine all these little variable costs into a single "cost per order" figure to keep your final calculation clean. To see how these costs fit into the bigger picture of your ad performance, check out our guide on understanding cost per acquisition metrics.
Building Your Data Checklist
To make sure nothing slips through the cracks, use this checklist before you start plugging numbers into a formula. A systematic approach like this prevents costly mistakes and gives you confidence that the final number is one you can trust.
Your Essential Data Checklist
Average Order Value (AOV): Pulled from your e-commerce platform for the last 90 days.
Cost of Goods Sold (COGS): The average cost to produce the items in a typical order.
Shipping & Fulfillment: The total average cost to get an order to the customer's doorstep.
Payment Processing Fees: Your effective rate from Stripe, Shopify Payments, etc.
Other Variable Costs: The average cost per order for returns, transaction-based software fees, or any other expense tied directly to a sale.
Once you have these five data points nailed down, you have what you need to calculate your true profit per order. That number is the key that unlocks an accurate, reliable breakeven ROAS—one that can truly guide your scaling decisions and protect your bottom line.
Unpacking the Breakeven ROAS Formula
At its heart, the math behind your breakeven point is surprisingly simple. You don't need some beast of a financial model to get started; you just need to nail down the fundamental link between your profit margin and your ad efficiency. This is precisely what a breakeven ROAS calculator is built to do.
The quickest path to finding your breakeven point is a clean, straightforward formula that hinges on your gross profit margin. This calculation gives you an incredibly powerful baseline—the absolute minimum performance your ads have to hit to stop you from bleeding cash.
The Core Formula
Breakeven ROAS = 1 / Gross Profit Margin
This simple equation is your starting point. It tells you exactly how much revenue you need to generate for every single dollar you spend on ads, just to cover the cost of the products you sold.
For example, if your business runs on a healthy 60% gross profit margin (that's 0.60 in the formula), your breakeven ROAS would be 1 / 0.60, which shakes out to 1.67x. This means any ad campaign delivering a ROAS above 1.67x is putting gross profit back in your pocket. It's a vital, back-of-the-napkin check for any campaign.
Moving Beyond the Basics for a True Profit Picture
While that basic formula is a fantastic start, relying on it alone can be a trap. It completely ignores a whole host of other variable costs that chip away at your profit on every single order—things like shipping, payment processing fees, and fulfillment costs. A truly accurate breakeven ROAS calculator has to factor in these details to paint a realistic picture of your profitability.
This is where we bring in a more robust formula. It still revolves around your profit margin, but it defines that margin with far more precision by subtracting all the variable costs from your revenue. The calculation itself is still simple: you're just dividing the product's selling price by the real profit you make on it. If you want to dive deeper into the nuts and bolts, leading e-commerce analysts at vulcan-digital.com offer some great insights into this core concept.
Breakeven ROAS Calculation Examples
Let's make this real by looking at two e-commerce brands on opposite ends of the spectrum. This is the best way to see why a "good" ROAS is completely relative to your specific unit economics.
To see this side-by-side, the table below shows just how different the breakeven point can be based on the numbers you plug into your breakeven ROAS calculator.
Metric | Brand A (High Margin) | Brand B (Low Margin) |
|---|---|---|
AOV | $120 | $150 |
Total Variable Costs | $40 | $112.50 |
True Profit per Order | $80 | $37.50 |
True Profit Margin | 66.7% | 25% |
Breakeven ROAS | 1.5x | 4.0x |
This comparison drives home a critical point: your breakeven ROAS is a unique fingerprint for your business. Simply adopting an industry benchmark or chasing a competitor's target is a surefire way to run into trouble. You have to do the work and understand your own numbers, inside and out.
A Tale of Two Brands
Let's break down the numbers from that table to see how we got there.
Brand A: The High-Margin DTC Skincare Brand
Imagine a skincare company selling premium serums. Their unit economics are solid:
Average Order Value (AOV): $120
Cost of Goods Sold (COGS): $24
Other Variable Costs (Shipping, Fees, etc.): $16 per order
First, we find the actual profit per order: $120 (AOV) - $24 (COGS) - $16 (Other Costs) = $80. Then, we calculate their true profit margin: $80 (Profit) / $120 (AOV) = 66.7%. Finally, we get their breakeven ROAS: 1 / 0.667 = 1.5x.
For this brand, any campaign that hits above a 1.5x ROAS is profitable. Those high margins give them a ton of breathing room and flexibility with their ad spend.
Brand B: The Low-Margin Home Goods Retailer
Now, let's picture a retailer selling bulky home decor items with much tighter margins.
Average Order Value (AOV): $150
Cost of Goods Sold (COGS): $90
Other Variable Costs (Shipping, Fees, etc.): $22.50 per order
Running the same math tells a very different story: First, the profit per order is just: $150 (AOV) - $90 (COGS) - $22.50 (Other Costs) = $37.50. This gives them a much slimmer profit margin: $37.50 (Profit) / $150 (AOV) = 25%. Which leads to a much higher breakeven ROAS: 1 / 0.25 = 4.0x.
This business needs to hit a 4.0x ROAS just to avoid losing money. A 3.5x ROAS, which would be a massive win for the skincare brand, is actively burning cash for this retailer. It's a perfect illustration of why knowing your number is non-negotiable.
Alright, let's get that section sounding like it was written by a seasoned media buyer who's been in the trenches.
Putting Your Breakeven ROAS to Work in Your Ad Accounts
Knowing your breakeven ROAS is one thing, but actually using it is where the magic happens. On its own, it’s just a number. Once you apply it inside your ad accounts, though, it becomes your most powerful decision-making tool. This figure is your line in the sand—it clearly separates the campaigns making you money from the ones draining your bank account.
The whole point of a breakeven ROAS calculator isn't just to spit out a number. It's about giving you the confidence to manage your Meta and Google Ads accounts with conviction. You'll know exactly what targets to set, how to judge performance, and when to make the tough calls that protect your profit.
This decision tree gives you a quick visual of how your product margins directly influence the ROAS you need to chase.
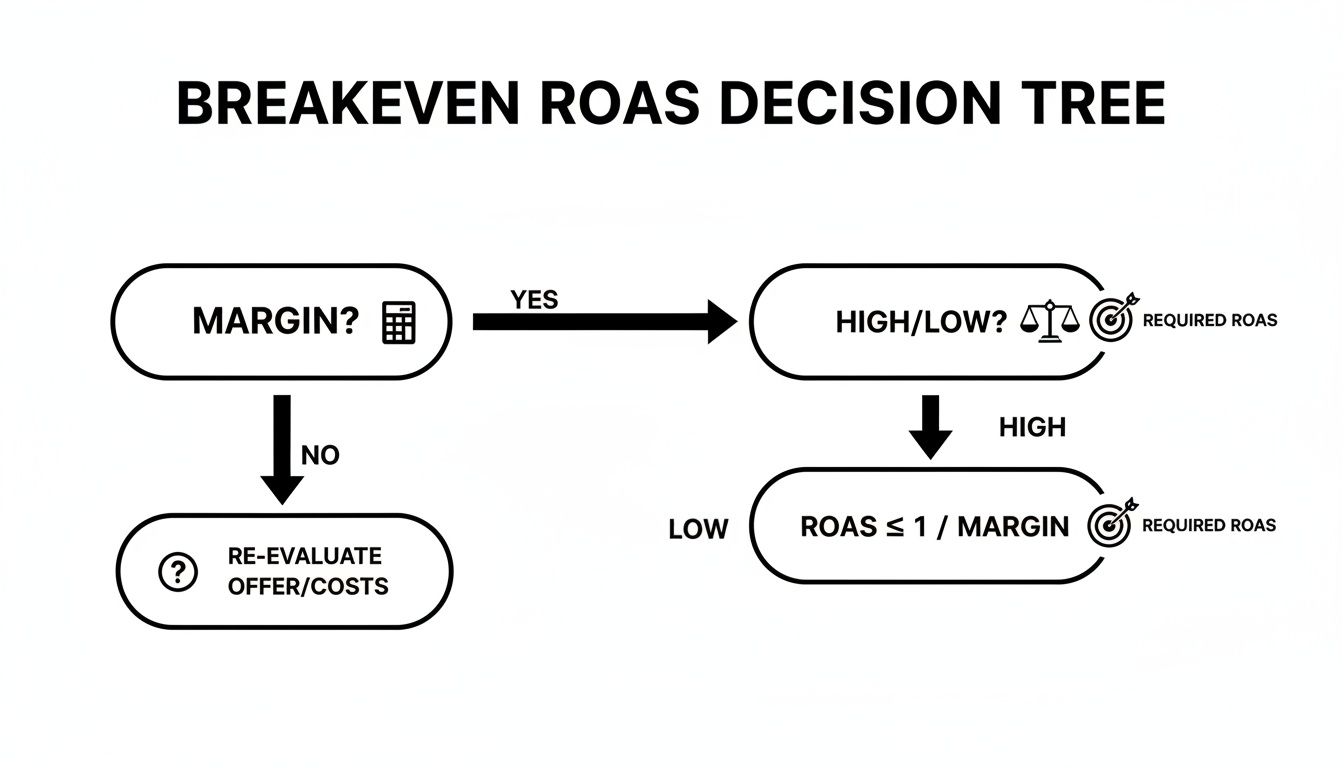
The takeaway here is simple: businesses with healthier margins have a lower breakeven point. That gives you way more breathing room and flexibility with your advertising.
Setting Your Target ROAS (Your Real Goal)
Let's be crystal clear: your breakeven ROAS is the floor, not the ceiling. If you're only hitting your breakeven, you're not losing money on ad spend, but you're not making any either. You're just running in place.
Think of it like this:
Breakeven ROAS: The number you need to survive.
Target ROAS: The number you need to thrive and grow.
You have to set a Target ROAS (tROAS) that’s comfortably above your breakeven point. A smart way to start is by factoring in your desired net profit margin. For instance, if your breakeven ROAS is 2.5x and you're aiming for a 20% net profit on sales from ads, you might set your tROAS at 3.0x or even higher. That becomes your new benchmark for a "good" campaign.
Setting a Target ROAS is what separates treading water from actually swimming forward. It ensures every dollar you get back doesn't just cover costs but actively fuels your business's growth and profitability.
Making Smart Calls Based on Performance
With your breakeven and target ROAS numbers handy, you now have a simple but effective framework for managing campaigns. Everything you run can be measured against these two goalposts, which leads to three clear scenarios.
Scenario 1: Performance is Above Your Target ROAS This is the dream scenario. The campaign is crushing your goals and printing money.
Action: It's time to scale. Start increasing the budget incrementally. Keep a close eye on performance, because efficiency can sometimes dip as you pour more money in.
Expert Tip: Dig into why it's working so well. Is it a specific creative? A certain audience? A keyword you struck gold with? Find the winning element and double down on it.
Scenario 2: Performance is Between Breakeven and Target ROAS You're in the green, which is good. The campaign is paying for itself and turning a small profit, but it's not quite a home run yet.
Action: Optimize before you scale. This is where you roll up your sleeves and look for inefficiencies. Can you refine your targeting? Tweak the ad copy? Pause the ads that are dragging the average down?
Expert Tip: This is the perfect time to A/B test new creatives or landing page variations. A small lift in conversion rate here could be all it takes to push performance into your target zone.
Scenario 3: Performance is Below Breakeven ROAS This is a code red. Every conversion is costing you more than you're making. You are actively losing money.
Action: Stop the bleeding. Your immediate move should be to either slash the budget or pause the campaign altogether.
Expert Tip: Before you delete it forever, do a quick post-mortem. Was the audience wrong? Was the offer weak? Did the creative just get stale? Sometimes a losing campaign can be revived with a completely fresh angle, but only after you've stopped it from losing more money.
What About the Gray Areas?
Of course, real-world advertising is messy and rarely fits into neat little boxes. You'll constantly run into situations that require more than just a quick glance at your ROAS column.
Here's a classic dilemma: you have a Meta ad set that's running below your breakeven ROAS, but the Cost Per Acquisition (CPA) is incredibly low. Your gut reaction might be to kill it. After all, it’s not profitable today.
But this is where you have to think beyond the first sale. If you know your Customer Lifetime Value (LTV) is solid, that cheap acquisition might be a brilliant long-term play. If a customer acquired at a small loss today is likely to make two or three more purchases down the line, you're actually making a savvy investment.
This is why your breakeven ROAS calculator is a foundational tool, not the only tool. It gives you the instant gut check on immediate profitability. You then have to layer that data with deeper business metrics—like LTV and your overall customer acquisition goals—to make the truly smart, strategic decisions.
Common Pitfalls and Advanced Scenarios
Getting your basic breakeven ROAS formula dialed in is a huge win. But the real world of e-commerce is messy, and I’ve seen countless brands build a calculator, feel great about it, and then scratch their heads when their P&L tells a different story.
This usually happens when a few pesky, real-world details get overlooked. These small omissions can seriously skew your breakeven point, giving you a false sense of security. It’s like navigating with a compass that's off by just a few degrees—you won’t notice at first, but you'll end up miles from where you intended to be.
The Hidden Costs That Wreck Your Math
By far, the most common mistake is failing to account for all the variable costs tied to an order. It's easy to remember your COGS and the main shipping fee, but a few others almost always slip through the cracks. Each one is a tiny leak in your profit bucket.
These "profit leaks" can quietly turn a campaign you think is profitable into one that's losing you money with every conversion.
You have to be brutally honest with your numbers. Make sure these costs are in your calculation:
Payment Processing Fees: That 2.9% + $0.30 from Shopify Payments or Stripe isn't pocket change. On a $100 order, that’s $3.20 that vanishes before the revenue even hits your bank account.
Return Costs: This is a big one. Don't just track your return rate; calculate the total cost of a return. This includes the return shipping label, the labor to restock the item, and any loss if the product comes back damaged. If 10% of your orders are returned at an average cost of $15, you need to add $1.50 in costs to every single order you ship out.
Transaction-Based Software: Do you use any apps that take a small percentage of each sale? That’s a variable cost, and it needs to be factored in.
Forgetting these small costs is the number one reason why a brand’s P&L statement doesn't align with their ad account performance. A truly accurate breakeven ROAS calculator must be exhaustive in its accounting of variable expenses.
Navigating SKU-Level Profitability
Another trap I see people fall into is relying on a single, store-wide breakeven ROAS when their product catalog has a mix of margins. If you sell a high-margin hero product alongside a low-margin accessory, a blended ROAS is dangerously misleading.
Let's imagine you have two main products:
Product A: Has a 70% profit margin. Your breakeven ROAS for this item is 1.43x.
Product B: Only has a 30% profit margin. The breakeven ROAS here is a much higher 3.33x.
Now, let's say your blended, store-wide breakeven ROAS is 2.5x. You run a campaign focused on Product B, and it hits a 2.8x ROAS. According to your blended goal, that's a winner! But in reality, you're losing money on every single sale. This is exactly how you can scale a "successful" campaign and watch your overall business profitability tank. For a deeper dive into how tracking impacts ad platforms, our guide on the Meta Conversions API offers valuable context.
The solution is to calculate a breakeven ROAS for individual SKUs, or at the very least for your main product categories. This gives you the clarity to run profitable campaigns for specific items, which is especially critical for platforms like Google Shopping where you have that granular, SKU-level control.
Advanced Scenario: LTV and Subscription Models
The standard breakeven ROAS calculator is built around a single transaction. But what happens when that first purchase is just the start of a long customer relationship? This is where Lifetime Value (LTV) becomes essential, particularly for subscription-based businesses.
For a subscription brand, it's often a smart move to acquire a customer at a loss on their first order, because you're confident you'll make it back (and then some) over the next few months. Your whole mindset has to shift. Your breakeven point is no longer tied to that initial sale but to the entire customer lifecycle.
Here, the calculation evolves from "breakeven ROAS" to "breakeven CAC" (Customer Acquisition Cost). The key metric becomes your LTV-to-CAC ratio. For instance, if your average customer pays $50/month and sticks around for 6 months ($300 LTV), you can easily afford to spend much more than the initial $50 to acquire them and still be wildly profitable.
This more advanced approach requires solid LTV tracking, but it opens the door to much more aggressive—and ultimately more profitable—customer acquisition strategies. It transforms your advertising from a simple direct-response machine into a long-term growth engine for your business.
Common Questions About Breakeven ROAS
Even with a perfect calculator built, there are always those "what if" questions that pop up. That’s totally normal. The world of paid ads isn't clean and simple, so understanding how your breakeven ROAS fits into the messy reality of running an e-commerce business is what separates good marketers from great ones.
I've put together answers to the most common questions I hear from fellow operators and marketers. My goal is to give you short, practical answers you can use today.
How Often Should I Recalculate This?
Your breakeven ROAS is not a "set it and forget it" number. It’s a living metric that breathes with your business's unit economics.
As a general rule, I recommend recalculating it quarterly. That’s usually frequent enough to catch important shifts in your business without adding another tedious task to your plate.
However, certain events should trigger an immediate update. Think of these as red flags telling you the ground has shifted beneath your feet.
Supplier Cost Changes: The most obvious one. If your COGS go up or down, your entire margin structure changes, and so does your breakeven point.
New Shipping Rates: Your shipping carrier just raised prices? That hits your bottom line directly and needs to be factored in right away.
Major AOV Swings: Maybe you rolled out a new bundling strategy that actually worked, and your AOV is way up. That's great news—it means your breakeven ROAS just dropped, giving you more breathing room.
Big Sales Events: Running a Black Friday sale where everything is 30% off? Your margins are getting squeezed, hard. You absolutely need to calculate a temporary breakeven ROAS for that promotional period to know if your ads are actually working.
Can I Use the Same Breakeven ROAS for Google and Meta?
Yes, absolutely. In fact, you should start there. Think of your breakeven ROAS as your universal, non-negotiable floor. If any campaign, on any platform, dips below this number, you know with certainty that you're losing money on that first sale.
But once you've got that baseline covered, the more advanced move is to think about your target ROAS for each channel.
Breakeven ROAS is your survival number. Target ROAS is your success number. They are rarely the same across different platforms.
For example, your target ROAS for a high-intent Google Shopping campaign should probably be pretty high—those people are ready to buy now. But for a top-of-funnel Meta prospecting campaign aimed at new customer acquisition, you might be perfectly happy with a lower ROAS, banking on that customer's future lifetime value.
Help! My ROAS Is Below Breakeven, but My Business Is Growing. What Gives?
This is an incredibly common scenario, especially for VC-backed brands that are in full-on growth mode. It feels counterintuitive, but there's a simple explanation: you're making a calculated bet on customer acquisition.
Essentially, you're choosing to lose a little money on the first sale because you're confident you'll make it back (and then some) over the customer's lifetime. This strategy is only viable if you have an ironclad grasp on your Customer Lifetime Value (LTV).
If a customer's LTV is significantly higher than what you paid to acquire them (your CAC), then you're making a smart investment. But if you aren't tracking LTV accurately, you're not being strategic—you're just "buying revenue" at a loss and hoping for the best.
How Does This Actually Help Me Scale Ad Spend Safely?
This is where the magic happens. A breakeven ROAS calculator is your ultimate safety net when you start pushing the pedal on ad spend. It’s a law of physics in paid media: as you increase budgets, efficiency tends to drop. That high ROAS you had at $500/day gets a lot harder to maintain at $5,000/day.
Your breakeven ROAS acts as the guardrail.
As you scale a campaign, if you see its ROAS start trending down toward your breakeven point, you have an instant, data-backed signal to pull back or re-optimize. It prevents you from making the classic, costly mistake of scaling yourself straight into the red. It gives you the confidence to pour fuel on your winners, knowing exactly where the cliff's edge is.
Turning messy ad data into clear, profitable actions is what we're obsessed with at SpendOwlAI. Our platform doesn't just show you data; it delivers a daily, ranked list of exactly what to change in your ad accounts and explains why. Start your free 7-day trial and see how SpendOwlAI can help you execute with confidence.