A Guide to Recency Frequency Monetary Segmentation
Ever wonder who your truly best customers are? It’s not always the ones you think. Recency, Frequency, Monetary (RFM) segmentation is a powerful way to find out, using the data you already have. It’s a method for understanding customer behavior by looking at three simple things: how recently they bought, how often they buy, and how much they spend.
This isn't just about sorting names into lists; it’s about turning your raw sales data into a clear roadmap for smarter marketing.
What Is RFM Segmentation And Why Does It Matter?
Think of it like the classic neighborhood shopkeeper who knows everyone by name. They instinctively know who just stopped by yesterday, who pops in every Friday for their usual, and who only shows up for the big holiday sales. RFM analysis gives your online brand that same intuitive, personal understanding—but at a massive scale.
Instead of blasting the same message to everyone, RFM lets you see your customers in distinct groups based on their actions. This is a fundamental shift from asking "who are my customers?" to understanding "what are my customers doing?" That behavioral focus is the secret to its effectiveness.
The Power of Behavior-Based Insights
By analyzing past purchase behavior, RFM helps you make incredibly strong predictions about the future. It’s common sense, really. A customer who bought from you yesterday is far more likely to engage with an email than someone who hasn't visited your site in a year. Likewise, a customer who buys something every month is inherently more valuable than a one-and-done shopper, even if their individual purchases are small.
This is exactly why segmentation is so important for growth. The "Monetary" value adds the final, crucial layer. It helps you distinguish between your frequent-but-frugal shoppers and the big spenders who purchase less often. Each group has different motivations and needs a completely different approach.
At its core, RFM analysis helps you answer three critical business questions: Who are my best customers? Which customers are in danger of churning? And who has the potential to become more valuable?
To get a clearer picture, let's break down each component.
The Three Pillars of RFM Segmentation Explained
This table shows how each element works together to create a holistic view of your customer base.
Component | What It Measures | Why It's Important | Example Question It Answers |
|---|---|---|---|
Recency (R) | The time since a customer's last purchase. | Recent customers are generally more engaged and responsive to marketing. | "Who has purchased in the last 30 days?" |
Frequency (F) | The total number of purchases a customer has made over a specific period. | High-frequency customers are often your most loyal and satisfied buyers. | "Who are my repeat buyers vs. one-time purchasers?" |
Monetary (M) | The total amount of money a customer has spent. | This identifies your big spenders and helps measure the lifetime value. | "Who are the top 10% of spenders in the last year?" |
Looking at these three factors together gives you a far richer understanding than focusing on just one.
The Financial Impact of RFM
This isn't just a theoretical exercise; RFM directly impacts your bottom line. When you focus your efforts with this level of precision, you stop wasting money on customers who have tuned out and can invest more in those most likely to buy again.
The numbers don't lie. A landmark study of fashion e-commerce brands revealed that high-frequency segments—which made up just 12% of the customer base—were responsible for a whopping 55% of the profits. Their average order value was also three times higher than that of one-time buyers.
This proves a vital point: not all customers are created equal when it comes to profitability. Finding and nurturing your high-value segments is one of the most efficient growth strategies available. To dig even deeper into these concepts, check out this excellent guide on RFM Customer Segmentation.
With this model, you can finally move away from generic, one-size-fits-all promotions and start creating personalized, high-impact campaigns that boost both retention and revenue. In the next sections, we'll get into the nitty-gritty of how to calculate these scores and put them to work for your brand.
How to Score and Segment Your Customers

The real power of recency frequency monetary segmentation kicks in when you turn raw transaction data into simple, actionable scores. This isn't about firing up a complex machine learning model; it’s really just a smart way of sorting your customers. You're simply assigning each person a score for Recency, Frequency, and Monetary value, typically on a scale from 1 to 5.
Think of it like grading papers. A score of 5 is your A+ student—the one who shows up, participates, and aces the test. In RFM terms, this is your most recent, most frequent, or highest-spending customer. On the other end, a score of 1 is someone who’s stopped showing up to class entirely.
By combining these three individual scores, you create a three-digit RFM profile for every single customer. This isn't just a random number; it's a powerful fingerprint of their buying behavior. For instance, a customer with a 555 score is your gold standard—they bought yesterday, they buy all the time, and they spend big. In stark contrast, a 111 customer has likely churned; they haven't been seen in ages, only bought once, and spent very little.
Turning Scores into Segments
Once every customer has a score like 542 or 135, what's next? You don't need to get lost analyzing hundreds of unique combinations. The goal is to group these scores into broader, more meaningful segments.
This is where you shift from looking at numbers to understanding people. These segments give your customers personas, helping you see who they really are in relation to your business. It’s the key to talking to them in a way that actually connects.
Here are a few of the most valuable RFM segments you’ll find:
Champions (555): These are your rockstars. They’ve bought recently, they buy often, and they spend the most. Roll out the red carpet for them.
Loyal Customers (X5X): These folks are the bedrock of your business. They buy frequently, even if they aren't your biggest spenders. Loyalty programs and exclusive perks work wonders here.
Potential Loyalists (X3-5X): You've got their attention. They’re recent, have spent a decent amount, and show signs of becoming a frequent buyer. It's time to nurture that relationship.
New Customers (5XX): They just made their first purchase—congrats! Now the real work begins. A killer post-purchase experience is crucial to get them to come back for more.
By classifying customers, you're not just tidying up a spreadsheet; you're building a strategic map. It shows you exactly where to point your marketing efforts—who to reward, who to nurture, and who needs a gentle nudge to come back. Campaigns aimed at 'Champions' consistently see 3-5 times higher engagement than your average marketing blast.
Identifying At-Risk and Lost Customers
Just as crucial, recency frequency monetary segmentation acts as an early-warning system, highlighting customers who are starting to drift away. Catching them now is far cheaper and more effective than trying to win them back after they're long gone.
Pay close attention to these groups:
At-Risk Customers (2-3 4-5 X): These were once great customers—they bought often or spent a lot—but they've gone quiet. You need to launch a win-back campaign before they're gone for good. A well-timed reactivation offer can boost retention by up to 50%.
Hibernating (1-2 2-3 X): Their last purchase was a while ago, and they were never very frequent buyers to begin with. They might still open an email here and there, but they’re effectively dormant.
Lost Customers (111): The name says it all. They haven't made a purchase in a very long time, and bringing them back will require a significant—and probably expensive—effort.
To get the most out of this process, it helps to look at other customer segmentation examples outside of RFM. Seeing how other brands slice their audience can spark new ideas for your own strategy.
Ultimately, combining the R, F, and M scores gives you a clear, three-dimensional picture of customer value. It’s how you finally move past one-size-fits-all marketing and start making decisions based on real behavior.
Alright, let's get our hands dirty and turn the idea of recency, frequency, and monetary segmentation into a reality. The good news? You don’t need a massive data science team to get this off the ground. It all starts with the transaction data you already have sitting in your e-commerce platform, whether that's Shopify, WooCommerce, or any other system.
Putting this into action is often much simpler than people think. The entire process hinges on getting your hands on just three key data points for every single order you've ever received. This is the raw material that will fuel all your customer insights.
Gathering Your Core Data
First things first, you need to pull a complete list of your historical transactions. Think of it as a giant spreadsheet or database table. For every order, you need to grab three crucial pieces of info:
Customer Identifier: A unique ID for each customer, like a customer number or email address.
Order Date: The exact date the purchase happened.
Order Value: The total amount of money spent on that order.
That's it. Seriously. With just these three fields, you have everything you need to calculate the Recency, Frequency, and Monetary values for every customer in your database. This simple data pull is the foundation for everything that follows.
Calculating Your R, F, and M Values
With your transaction data in hand, the next step is to roll it all up to the customer level. Your goal is to transform that long list of individual orders into a tidy summary, with one row for each customer, that captures their entire buying history in three numbers.
Here’s exactly what you'll calculate for each unique customer:
Recency (R): Look at all of a customer's purchases and find the date of their most recent one. Then, figure out how many days have passed between today (or a set analysis date) and that last purchase. A smaller number here is better—it means they bought more recently.
Frequency (F): Simply count the total number of orders that customer has placed over a specific period, like the last two years. More orders mean a higher frequency.
Monetary (M): Add up the total value of all orders the customer has ever placed with you. A bigger total means a higher monetary value.
If you’re comfortable with databases, you can crunch these numbers in a flash with a SQL query. A query like this takes your raw orders table and does the heavy lifting, spitting out the customer-level summary you need.
Here’s a simplified example of what that query might look like:
WITH CustomerData AS (
SELECT
customer_id,
order_date,
order_value
FROM
orders
),
RFM_Base AS (
SELECT
customer_id,
MAX(order_date) AS last_purchase_date,
COUNT(order_date) AS frequency,
SUM(order_value) AS monetary
FROM
CustomerData
GROUP BY
customer_id
)
SELECT
customer_id,
-- For Recency, we calculate days since last purchase
DATEDIFF('day', last_purchase_date, GETDATE()) AS recency,
frequency,
monetary
FROM
RFM_Base;
This script gives you a clean table with one row per customer, each holding their personal R, F, and M values—perfectly prepped for the final scoring step.
Assigning Scores and Creating Segments
Now for the fun part. Once you have the R, F, and M values for everyone, it's time to score them. The most straightforward method is using quintiles, which is just a fancy way of saying you'll rank your customers for each metric and then divide them into five equal groups.
For example, you'd rank all customers by Recency. The top 20% (the ones who bought most recently) get a Recency score of 5. The next 20% get a 4, and so on, until the bottom 20% (those who haven't bought in the longest time) get a 1. You do this same ranking-and-scoring process separately for Frequency and Monetary value.
A key takeaway is that a high score is always good. For Recency, this means fewer days since the last purchase. A customer who bought yesterday gets a 5, while someone who last bought two years ago gets a 1.
After scoring, every customer has a three-digit RFM score, like 555 (your absolute best customer) or 123 (a low-value, infrequent buyer who's gone quiet). You can then group these scores into those practical segments we talked about, like "Champions" or "At-Risk Customers." This kind of analysis is a perfect example of effective data-driven marketing solutions because it gives you a clear path from raw numbers to smart, strategic action.
With these segments defined, you’re ready to start tailoring your marketing, personalizing your communication, and making smarter decisions that genuinely move the needle.
This is where the rubber meets the road. You’ve put in the work to calculate RFM scores and segment your customers. Now, let's turn that data into real revenue. This is the part where analysis transforms into targeted, effective marketing.
Think about it this way: you wouldn't greet a first-time visitor to your store the same way you greet a loyal customer who knows your staff by name. Your marketing should work the same way. The goal is to talk to each customer segment in a way that truly reflects their relationship with your brand.
This approach isn't just about minor tweaks; it's a fundamental shift that leads to higher conversion rates, stronger loyalty, and a much healthier return on your marketing spend.
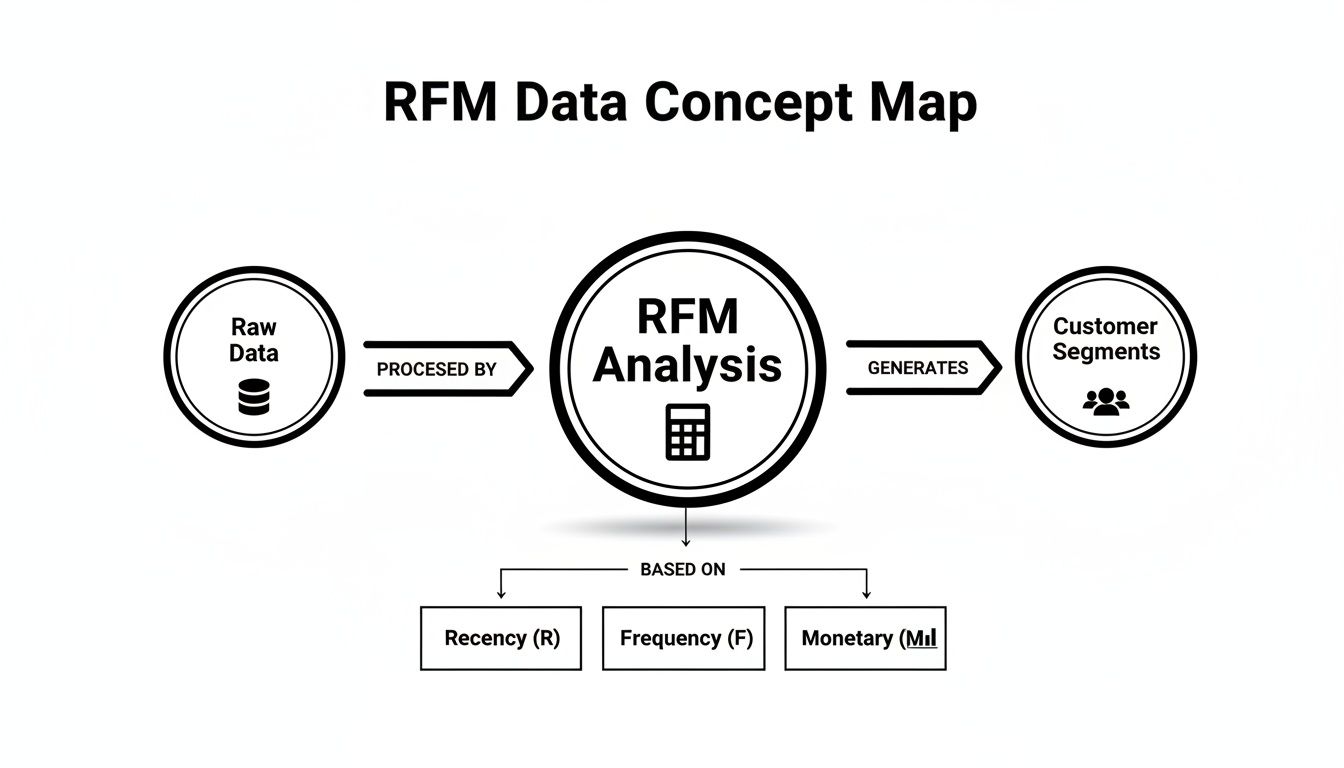
The diagram above shows the journey from raw data to actionable customer segments. By following this path, you stop shouting into the void with generic campaigns and start having meaningful conversations with your customers.
Mapping RFM Segments to Marketing Actions
To get started, you need a playbook. This simply means deciding which channels, campaign types, and goals make sense for each RFM group. Your "Champions" need a very different message and offer than your "At-Risk" customers.
For example, a major online retailer found that their "Champions"—customers with top scores across Recency, Frequency, and Monetary value—made up just 8% of their customer base. But that small group was responsible for an incredible 42% of their total revenue.
Armed with this insight, they created exclusive campaigns just for this segment and saw a 35% open rate and a 12% conversion rate, blowing industry averages out of the water. If you're interested in the full case study, you can explore the findings on Optimove.com. This is a perfect example of how focusing your best efforts on your best customers pays massive dividends.
An RFM Segment Activation Playbook
To make this practical, here’s a table that maps common RFM segments to specific channels, goals, and actions. Think of it as a starting point for building your own activation strategy.
RFM Segment | Marketing Channel | Campaign Goal | Example Action | Primary KPI |
|---|---|---|---|---|
Champions | Email, Paid Social | Reward & Retain | VIP early access, exclusive content | Customer Lifetime Value (CLV), Repeat Purchase Rate |
Loyal Customers | Email, SMS | Upsell & Advocate | Loyalty program tiers, "request a review" campaign | Purchase Frequency, Average Order Value (AOV) |
At-Risk | Email, Paid Social | Win Back | "We miss you" discount, targeted re-engagement ads | Reactivation Rate, Open Rate |
New Customers | Nurture & Educate | Welcome series, post-purchase onboarding flow | 2nd Purchase Rate, Engagement Rate | |
Hibernating | Paid Social, Email | Reactivate | Survey to ask why they left, high-value offer | Churn Rate, Reactivation Rate |
This playbook helps you move beyond theory and start running campaigns that are perfectly tuned to where each customer is in their journey with your brand.
Campaign Ideas for Key Segments
Let's get more specific. Here are some concrete actions you can take for your most valuable segments.
For Your Champions (555): These are your brand evangelists. Your goal isn't to squeeze another sale out of them; it's to reward their loyalty and make them feel seen.
Grant early access to new products before anyone else.
Invite them to a private community on Slack or Facebook.
Send a surprise like a handwritten thank-you note or a small gift.
For Your Loyal Customers (X5X): This group buys from you often and clearly likes what you're doing. The mission here is to deepen that connection and keep them coming back.
Offer smart cross-sells or exclusive bundles based on their purchase history.
Enroll them in a loyalty program where their frequent buys unlock real perks.
Ask for their opinion—they are your best source for honest reviews and feedback.
By tailoring your communication, you're not just sending another email; you're nurturing a relationship. A targeted campaign for "Champions" can produce 3-5 times higher engagement than a generic marketing blast sent to your entire list.
Winning Back Customers and Nurturing New Ones
RFM is just as critical for saving customers as it is for celebrating them. It’s an early-warning system that tells you when a valuable relationship is starting to fade.
Re-Engaging "At-Risk" Customers (e.g., scores 2-3 for Recency, 4-5 for Frequency) These are people who used to be regulars but have gone quiet. A proactive win-back campaign can bring them back before they're gone for good.
A "We Miss You" Email: Send a personalized message acknowledging their history with you and include a compelling, time-sensitive offer to encourage a return visit.
Custom Audience Ads: Upload their email addresses to a platform like Meta to run targeted ads showing off new products or reminding them of what they loved.
A Simple Survey: Ask them what's up. The feedback itself is gold, and just reaching out can be enough to restart the conversation.
Nurturing "New Customers" (e.g., score 5 for Recency, low for others) A customer's first purchase is a great start, but the real work begins now. A fantastic post-purchase experience is how you earn their second sale and turn them into a loyalist. You can build a dedicated email flow to onboard them, and for a complete breakdown, check out our guide on the drip campaign definition.
By putting a playbook like this into action, you turn recency, frequency, and monetary segmentation from a data science exercise into a powerful, dynamic engine for revenue growth.
Common RFM Mistakes and How to Avoid Them
Getting your recency frequency monetary segmentation live is a great feeling, but the real work has just begun. I've seen too many brands get swept up in the initial excitement of the insights, only to stumble on the execution. It's a powerful framework, but its value collapses if you're not careful.
The single most damaging mistake is treating RFM like a one-and-done project. You run the analysis, create your segments, and then… you let them gather dust. What you've really done is take a single snapshot of your customer base, and that picture gets outdated fast.
The Problem with Static Segments
Your customers are constantly changing. A "Loyal Customer" from last quarter could easily be "At-Risk" today after a few months of silence. A "New Customer" might make two more quick purchases and suddenly look like a "Potential Loyalist."
When your segments don't reflect these real-time shifts, your marketing becomes tone-deaf. Imagine sending a "We miss you!" discount to someone who literally just bought from you yesterday, all because your data is three months old. It's not just a waste of money; it's a bad experience that makes your brand look disconnected.
Static segmentation is like trying to navigate a busy highway using a printed map from last year. You have a general idea of the landscape, but you're blind to the real-time traffic, detours, and opportunities right in front of you.
The fix? Your RFM model needs to be a living, breathing part of your marketing operations. You have to set up an automated process to recalculate scores and refresh your segments on a regular schedule. For a fast-moving e-commerce store, that might be weekly. For a brand with a longer buying cycle, monthly might do the trick. This ensures your actions are always rooted in what customers are actually doing now.
Overcomplicating the Model
On the flip side of doing nothing is trying to do everything at once. It's easy to fall into the trap of building a model with ten scoring tiers, complex weighted variables, and dozens of micro-segments. It feels more precise, but it almost always leads to analysis paralysis.
If your segments are too granular, you'll never be able to create and manage distinct campaigns for each one. It becomes an operational nightmare.
Instead, start simple. The classic 1-5 scoring system and the 8-10 core segments we've discussed, like "Champions" and "At-Risk," are more than enough to drive massive results. Nail the fundamentals first. You can always layer in more complexity once the basic system is a well-oiled machine.
Here are a few other common missteps I see all the time:
Ignoring RF When M is Low: What if you sell a subscription or products with very similar prices? The Monetary value won't vary much, but that doesn't make the model useless. An "RF" analysis alone is still incredibly powerful for spotting your most engaged and loyal customers versus those who are fading away.
Forgetting to Validate Segments: How do you know your segments are actually working? You have to track how customers move between them. A healthy business should see a clear flow of customers from "New" to "Potential Loyalist" and then to "Loyal." If you see a mass exodus toward your "Hibernating" or "Lost" segments, you have a clear, data-backed signal that your retention efforts need a serious overhaul.
By steering clear of these common pitfalls, you can make sure your RFM strategy delivers lasting, reliable value. The whole point is to keep it simple, keep it fresh, and focus on turning those insights into consistent action. This is exactly the kind of operational rigor that platforms like SpendOwlAI are built to support, helping you move from analysis to confident execution, day in and day out.
Your Questions on RFM Segmentation Answered
Okay, you've got the theory down. You see the power of recency, frequency, and monetary segmentation. But as you get closer to actually flipping the switch, a few practical questions always pop up. That’s completely normal. Getting this right is all about nailing the execution.
Let's walk through the most common questions I hear from marketers. My goal is to give you clear, direct answers so you can move from planning to action with confidence. Think of this as the final pre-flight check before your RFM strategy takes off.
How Often Should I Recalculate My RFM Segments?
The textbook answer is "it depends," but that’s not very helpful, is it? The real answer lies in your business's natural rhythm and your customers' buying habits. You want your data to be fresh enough to act on, but not so fresh that you're just chasing noise.
For a fast-moving brand—think cosmetics or fashion where people might buy every month—you need a faster cadence. Recalculating weekly, or at most bi-weekly, is the sweet spot. In these businesses, a customer's recency score can go stale in a matter of weeks. You have to move fast to catch an "At-Risk" customer before they're gone for good.
On the other hand, if you're selling furniture or high-end appliances, your purchase cycle is much, much longer. It would be overkill to refresh your segments every week. A monthly or even quarterly recalculation is perfectly fine because customer behavior just doesn't change that quickly.
The most important thing is to automate it. Don't fall into the trap of manually pulling spreadsheets. That's a surefire way to be working with outdated information. Set up a pipeline or a tool that crunches the numbers on a schedule that fits your business. Your marketing should never be based on old news.
Can I Use RFM If My Products All Have a Similar Price?
Absolutely. This is a common misconception. If the M (Monetary) value is pretty flat across your customer base, you just put more weight on the R and F. In fact, Recency and Frequency alone are incredibly powerful.
Think about it. Knowing who bought last week versus last year (Recency) is a game-changer for targeting. And spotting the person who buys something every single month versus the one-and-done buyer (Frequency) is the very foundation of retention marketing.
Even without a wide range of price points, these two metrics give you a crystal-clear picture of customer engagement. They let you separate your true fans from the casual buyers, which is exactly what you need to build long-term value.
What Is the Difference Between RFM and a Loyalty Program?
I love this question because it shows someone is thinking strategically. The two work together beautifully, but they are not the same thing. They're partners in the same mission: creating loyal customers.
RFM segmentation is an internal tool for understanding. It's a behind-the-scenes analysis of your transaction data that tells you who your best customers are based on their actual behavior. It’s your map of the customer landscape.
A loyalty program is an external program for influencing. It's the public-facing strategy you use to actively encourage that behavior, typically with points, tiers, or exclusive rewards. It’s the vehicle you use to navigate that map.
The real magic happens when you use RFM to make your loyalty program smarter. For instance, your RFM analysis might highlight a group of "Potential Loyalists." These are customers who buy often but don't spend a lot. You can use your loyalty program to send them a targeted offer—like double points on their next order—to nudge them into a higher spending bracket.
Or, you could automatically enroll your "Champions" into a VIP tier of your program. This instantly rewards them for the loyalty they're already showing, turning your analytical insight into a real-world, feel-good moment for your best customers.
How Do I Measure the ROI of Implementing RFM Analysis?
This is the most important question of all. If you can't prove the value, the initiative will eventually die. Measuring the ROI of RFM means comparing the performance of your new, targeted campaigns to the old "batch and blast" method.
A/B testing is your best friend here. Take your "At-Risk" segment, for example. Create a compelling win-back campaign and send it to 80% of that group. The other 20% becomes your control group—they get nothing special. After a few weeks, compare the reactivation rate between the two groups. The difference, or "lift," is the direct result of your RFM-powered campaign.
To prove the financial impact, focus on tracking these metrics:
Lift in Conversion Rate: Are your targeted emails to "Champions" converting better than your generic newsletters?
Increase in Customer Lifetime Value (CLV): Are your nurture campaigns successfully graduating customers from "New" to "Loyal," increasing their total worth to the business?
Reduction in Churn Rate: Are your efforts to re-engage "Hibernating" customers actually lowering your overall churn?
When you connect your recency, frequency, and monetary segmentation to these bottom-line numbers, you're no longer just doing smart marketing—you're building a powerful, data-backed growth engine.
Moving from manual analysis to confident, daily execution is the final step. Instead of getting lost in spreadsheets, SpendOwlAI provides a clear, ranked list of actions to take across your ad accounts. It turns complex data into simple, explainable guidance, ensuring you focus on what truly matters. Start your free 7-day trial and see how data-backed confidence can transform your execution.