Mastering the Customer Retention Rate Formula for DTC Growth
At its core, the standard customer retention rate formula is a straightforward calculation: (((E - N) / S) x 100). This simple equation tells you what percentage of your customers have stuck around over a specific period. Getting a handle on this is fundamental for building a business that lasts.
Why Your Brand's Future Depends on This Formula
Picture your business as a bucket. Your marketing campaigns are constantly pouring new customers in at the top. But if that bucket is full of holes—maybe from a clunky product experience, so-so customer support, or just a weak connection to your brand—you're losing customers just as fast as you're getting them. That cycle of constant churn is incredibly expensive and, frankly, exhausting.

The customer retention rate formula is how you measure the size of those leaks. It helps you shift your energy from the never-ending, costly task of refilling the bucket to the much more profitable strategy of just plugging the holes.
The True Cost of a Leaky Bucket
It’s a classic mistake for growing brands to focus only on acquisition. The thrill of new sales can easily hide deeper problems. The data, however, tells a different story: keeping the customers you already have costs a whole lot less than finding new ones.
A revealing 2024 analysis showed that keeping an existing customer is up to 700% cheaper than acquiring a new one. This stat alone shows why this formula is absolutely non-negotiable for DTC founders and agencies. You can dive deeper into these customer retention rate findings to see the full impact on modern brands.
A high retention rate is the ultimate signal of product-market fit and customer satisfaction. It proves you've built something people truly value, not just something they're willing to try once.
From Metric to Momentum
In the end, your retention rate isn't just a number to stick in a report. It's a direct reflection of your business's health and long-term viability. It affects everything from how efficiently you can spend on ads to your overall profitability. When you see your retention rate climbing, it means a few powerful things are happening:
Higher Customer Lifetime Value (LTV): Loyal customers simply spend more money with you over time.
Improved Ad Efficiency: You can afford to pay more to acquire a customer because you have confidence they'll stick around and make it worthwhile.
Stronger Brand Advocacy: Happy, long-term customers become your best salespeople through authentic, word-of-mouth referrals.
Getting this calculation right isn't just a math exercise. It's a core growth strategy that can turn your business from a leaky bucket into a resilient, profitable machine.
How to Calculate Your Customer Retention Rate Step by Step
Alright, let's move from theory to practice and actually run the numbers. The customer retention formula itself is straightforward, but its real power comes from making it a habit. Think of it like checking the oil in your car—doing it regularly helps you spot trouble long before you break down.
My goal here is to strip away the jargon and give you a clear, repeatable process you can use today. This isn't just abstract math; it's a vital health check for your business.
Step 1: Define Your Time Period
First things first, you need to decide on a consistent timeframe. Are you going to track this monthly, quarterly, or annually?
Monthly: This is perfect for fast-moving DTC brands. It lets you see the immediate impact of your campaigns and catch trends early.
Quarterly: A great middle ground. It smooths out any weird monthly fluctuations while still being responsive enough for strategic planning.
Annually: Best for a high-level, long-term look at customer loyalty.
There's no single right answer, but consistency is absolutely critical. Pick a timeframe and stick with it. That’s the only way you’ll know if you're truly comparing apples to apples.
Step 2: Gather Your Three Key Numbers
Next up, you'll need to pull three specific numbers for your chosen time period. Let's walk through this with a realistic example—we'll pretend we're running a Shopify store for the month of April.
Customers at the Start (S): How many unique customers did you have on day one? For our example, let's say we had 1,000 customers on April 1st.
Customers at the End (E): Now, how many unique customers did you have on the very last day of the period? We'll say we ended the month with 1,050 customers on April 30th.
New Customers Acquired (N): Finally, how many brand-new customers made their first purchase during April? Let's say we acquired 100 new people.
Step 3: Plug Your Numbers into the Formula
Now for the easy part. Just drop those numbers into the standard retention formula:
CRR = [ (E - N) / S ] x 100
Using our Shopify store example, it looks like this:
CRR = [ (1,050 - 100) / 1,000 ] x 100
CRR = [ 950 / 1,000 ] x 100
CRR = 0.95 x 100
CRR = 95%
Boom. Our store retained 95% of its existing customers in April, which is a fantastic result. Knowing this number is a crucial first step before you even think about optimizing your ad spend. After all, strong retention is what makes your acquisition costs worthwhile. If you're not familiar with that metric, it's worth checking out our guide on understanding Cost Per Acquisition.
Step 4: Set Up a Simple Tracker
You don't want to do this math by hand every month. The best way to stay on top of it is to build a dead-simple tracker in Google Sheets or Excel.
It just takes a few minutes to set up. You can create a sheet that automatically calculates your retention rate as you plug in the new numbers each month, making the whole process effortless.
Uncovering Deeper Insights with Cohort Analysis
A single, overall retention rate gives you a snapshot, but it doesn't tell you the whole story. It's like looking at a single photo from a party—you can see who’s there right now, but you have no idea who arrived when, who left early, or which group is having the most fun.
To truly understand how your customers behave over time, you need to watch the movie, not just look at the picture.
This is where cohort analysis comes in. It’s a powerful technique that groups customers based on a shared characteristic. For most e-commerce brands, the most useful cohort is the month or quarter they made their very first purchase.
From a Single Number to a Full Story
Instead of lumping all your customers together into one big bucket, you create distinct groups—the "January Cohort," the "February Cohort," and so on. Then, you track each group's retention rate separately over the following months.
This simple shift immediately starts to reveal patterns that a single, blended metric would completely hide.
For example, you might discover things like:
The "Big Sale" Effect: The cohort of customers you acquired during a Black Friday sale might have a much lower retention rate after 3 months compared to customers who joined in a quieter month like October. This tells you a lot about the quality of deal-driven shoppers.
Product Launch Impact: Did the cohort from the month you launched that blockbuster new product stick around longer? If so, you have proof that the new item is creating real loyalty, not just a one-off purchase.
This level of detail is a game-changer. It lets you connect specific marketing actions to long-term customer value, not just the initial sale. Learning more about the importance of customer segmentation can help you apply these principles across all your marketing.
Shifting Focus to Revenue Retention
While keeping track of customer counts is essential, tracking the dollars they spend can be even more revealing. This is especially true for brands with a diverse product catalog, which brings us to another key metric: Net Revenue Retention (NRR).
Net Revenue Retention moves beyond asking "How many customers did we keep?" and starts asking, "How much revenue from last month's customers did we keep?" This is the true measure of your store's financial health and customer loyalty.
The NRR formula takes into account not just the revenue you retained from existing customers, but also any expansion (upsells, cross-sells) and contraction (downgrades, returns). It shows you whether your retained customers are actually becoming more or less valuable over time.
For a direct-to-consumer brand, a high NRR is a powerful signal. It means your best customers aren't just staying—they're actively buying more, exploring new products, and deepening their relationship with your brand. This insight is fundamental for building a profitable business that doesn’t have to rely solely on the churn-and-burn of new customer acquisition.
What Is a Good Customer Retention Rate?
So, you’ve run the numbers and have your customer retention rate. Now what? A metric on its own is just a piece of data; it’s the context that turns it into a real insight. Figuring out whether your retention rate is "good" is the first step in using this number to actually improve your business.
Let's get one thing straight: there's no universal magic number. A "good" retention rate is completely relative. It can swing wildly depending on your industry, business model, and even how often customers are expected to buy your product. What looks fantastic for a brand selling daily-use consumer goods might spell trouble for a software company.
The trick is to stop chasing some mythical ideal and start looking at how you stack up against relevant benchmarks.
Benchmarking Your Performance
To get a real feel for where you stand, comparing your numbers to industry averages is a great starting point. This gives you a realistic yardstick to measure your own performance and helps you set goals that make sense for your specific market. For any e-commerce or DTC brand, this is non-negotiable.
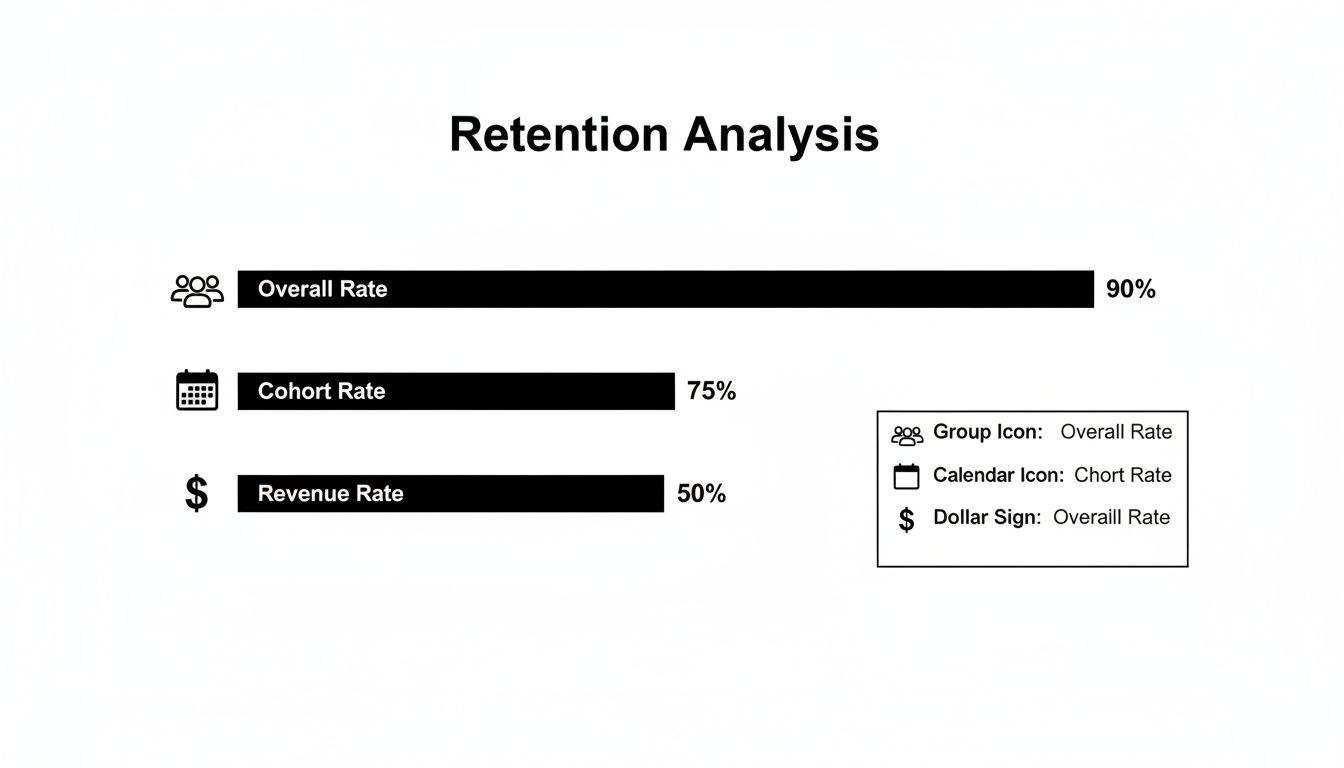
The visual below breaks down three critical ways to look at retention. You have your overall rate for a big-picture view, cohort rates to see how specific groups of customers behave, and revenue retention to understand the financial impact. Looking at all three gives you the full story.
For most direct-to-consumer businesses, the average retention rate tends to land somewhere around 30%. But again, this isn't a hard-and-fast rule. A subscription coffee brand should naturally have a much higher rate than a company selling durable goods like mattresses, which people only buy every few years.
The most important benchmark is your own history. Your primary goal should be to beat your last number. The aim is to create a consistent upward trend, not just hit a static, one-time target.
Customer Retention Rate Benchmarks by Industry
To give you a clearer picture of what "good" looks like across the board, we've compiled average annual retention rates for several key sectors. Use this table to see how your business compares to others in your field.
Industry | Average Annual Retention Rate |
|---|---|
Retail | 63% |
Banking | 75% |
Telecom | 78% |
IT Services | 81% |
SaaS | 83% |
Media | 84% |
Professional Services | 84% |
Insurance | 84% |
Remember, these figures are just averages. They provide a solid baseline, but the nuances of your own business model will ultimately determine what a healthy retention rate looks like for you.
Tracking Trends Over Time
Instead of getting hung up on a single percentage, the real power comes from watching how your retention rate changes over time. Is it inching up month-over-month? Did it dip last quarter? This is where your retention metric goes from a simple calculation to a strategic tool.
The magic happens when you start connecting those trends to your marketing and business activities. Did you launch a new email welcome series in March? Go check your April retention numbers. Rolled out a loyalty program in Q2? See how that Q2 cohort performs down the line compared to your Q1 group.
This is how the customer retention rate becomes more than just a formula—it transforms into an active feedback loop. It tells you exactly what’s working to keep customers coming back and what’s falling flat, letting you double down on the winners and build a more sustainable business.
Actionable Strategies to Improve Your Retention Rate
So, you've calculated your customer retention rate. That's the diagnostic step. Now it’s time to write the prescription, because a number on a spreadsheet does nothing until you take action to make it grow. Moving beyond generic advice is critical, especially for DTC brands where the line between customer experience and repeat purchases is razor-thin.

The best retention strategies aren't flashy, one-off campaigns. They're consistent, customer-obsessed habits that turn one-time buyers into genuine advocates for your brand. This means you need to listen intently, reward loyalty meaningfully, and always communicate with relevance.
Turn Feedback into Fuel for Growth
Your current customers are your single most valuable source of business intelligence, period. They know what works, what doesn't, and what they wish you offered. Ignoring them is like turning down free consulting from your most important stakeholders.
Actively gathering and acting on customer feedback is a direct line to a higher retention rate. When customers see their suggestions come to life, they feel heard and valued. It shifts their relationship with your brand from purely transactional to something more collaborative.
The most successful brands don't just sell to their customers; they build with them. This co-creation process is one of the stickiest drivers of long-term loyalty and retention.
Here are a few practical ways to make this a system, not a suggestion:
Post-Purchase Surveys: Go deeper than a simple star rating. Ask pointed questions like, "What almost stopped you from buying today?" or "If you could change one thing about this product, what would it be?"
Analyze Support Tickets: Your customer service inbox is a goldmine. Look for patterns in complaints or feature requests that signal a clear opportunity for improvement.
Monitor Reviews and Social Mentions: Pay close attention to the language people use when they talk about you organically. It’s raw, unfiltered, and incredibly valuable.
Personalize Communication and Build Community
In a market overflowing with options, personalization is what makes a customer feel seen. Generic email blasts and one-size-fits-all marketing are retention killers. Instead, use the data you already have to create experiences that feel handcrafted for each individual.
And this goes way beyond just slotting their first name into an email. Real personalization involves:
Segmented Campaigns: Group customers by purchase history, how often they buy, or the product categories they love. Someone who only buys skincare shouldn't be getting aggressive promos for your new makeup line.
Behavior-Triggered Emails: Set up automated messages based on what a customer does. Think a "How to Use" guide sent a week after purchase or a restock reminder when you know a consumable product is running low.
Building a strong community gives customers a reason to stick around that has nothing to do with their next purchase. An engaged community creates a sense of belonging and provides value beyond the product itself. A simple, well-managed Facebook group or a dedicated Slack channel for your top customers can forge surprisingly powerful connections.
Bridge the Gap Between Retention and Acquisition
Your retention data should never live on an island. The insights you get from your most loyal customers are rocket fuel for your paid acquisition efforts on platforms like Meta and Google. When you understand who sticks around, you know exactly who to go find more of.
For Shopify store owners, this is where SKU-level decisioning becomes a game-changer. By analyzing the repeat purchase rates of specific products, you can pinpoint your "hero" items—the ones that don't just sell well, but actually create loyal fans. These are the products you need to feature heavily in your top-of-funnel ad campaigns.
This creates a powerful virtuous cycle. You use retention data to acquire better-fit customers, who are naturally more likely to stick around. This, in turn, improves your retention rate and gives you even richer data for future acquisition. A great way to nurture these high-potential new leads is through well-structured email sequences. To dig deeper, check out our guide on what a drip campaign is and how to build one.
Common Questions About the Retention Rate Formula
Once you get the hang of the basics, you'll find that applying the customer retention formula to your own business brings up some new, trickier questions. Real-world data is messy, and edge cases always seem to pop up just when you think you've got it figured out.
This section is all about clearing up that confusion. We'll tackle the most common "what ifs" and "how tos" that we hear from DTC founders and marketers. Think of it as a final gut-check to make sure you can use this metric accurately every single day.
How Often Should I Calculate My Retention Rate?
There's no single "right" answer here—it really depends on how often your customers typically buy from you. The most important thing is to pick a cadence and stick to it. Consistency is what reveals the real trends.
For fast-moving ecommerce brands: A monthly calculation is usually your best bet. It gives you a frequent pulse-check on how your marketing campaigns or new product drops are affecting loyalty.
For subscription businesses: Go with a monthly or quarterly calculation. This lines up nicely with billing cycles and gives you a stable view of your customer base over time.
For brands with long purchase cycles: If you sell high-ticket items people don't buy often (think mattresses or furniture), a quarterly or even annual calculation makes more sense. Anything shorter might show wild swings that aren't actually meaningful.
The real takeaway? Pick a timeframe that makes sense for your business and track it consistently. That’s how you turn this number from a simple metric into a strategic tool.
Can a Retention Rate Be Over 100 Percent?
Great question. With the standard formula we've been using—the one that just counts customer heads—the answer is no. You can't keep more customers than you started with, so 100% is the ceiling.
However, a closely related metric absolutely can go past 100%. When you shift from counting customers to counting revenue, you get what's called Net Revenue Retention (NRR). If your existing customers start spending more money with you through upgrades, add-ons, or buying more frequently, your NRR can climb well above 100%. It’s a powerful sign of a healthy, growing customer base.
What Is the Difference Between Retention Rate and Churn Rate?
Think of them as two sides of the same coin. They tell the exact same story, just from opposite perspectives.
Retention Rate: The percentage of customers you kept.
Churn Rate: The percentage of customers you lost.
They are perfect inverses of each other. If your monthly retention rate is 90%, your monthly churn rate is 10%. Simple as that. Both are critical for understanding customer loyalty, but they measure opposite outcomes.
How Do I Calculate Annual Retention from Monthly Data?
It's tempting to just multiply your monthly churn rate by 12, but that’s a huge (and common) mistake. Churn compounds, meaning a small monthly leak can turn into a massive hole in your bucket over the course of a year.
The proper way to figure this out is with the formula: Annual Retention = (1 - Monthly Churn Rate) ^ 12.
Let’s say you have a 5% monthly churn. That doesn't equal 60% churn over a year. The compounding effect means you'd actually have a 46% annual churn rate, leaving you with only 54% of your customers. To dig deeper into the math, you can see how to properly derive yearly retention from monthly data and understand why this compounding is so critical for long-term planning.
Ready to stop guessing and start executing with confidence? SpendOwlAI delivers clear, daily actions for your Meta and Google ads based on real performance data. Move beyond noisy dashboards and get a ranked list of what to change today, ordered by impact, so you can save time and reduce wasted ad spend. Start your free 7-day trial and see the difference.